Bitcoin’s spot trading volumes over the past week show a varying level of market activity and sentiment. Bitcoin’s price saw some volatility over the week, peaking on May 25 at $69,270, followed by a slight decline and stabilization around the $68,000 to $69,000 range.
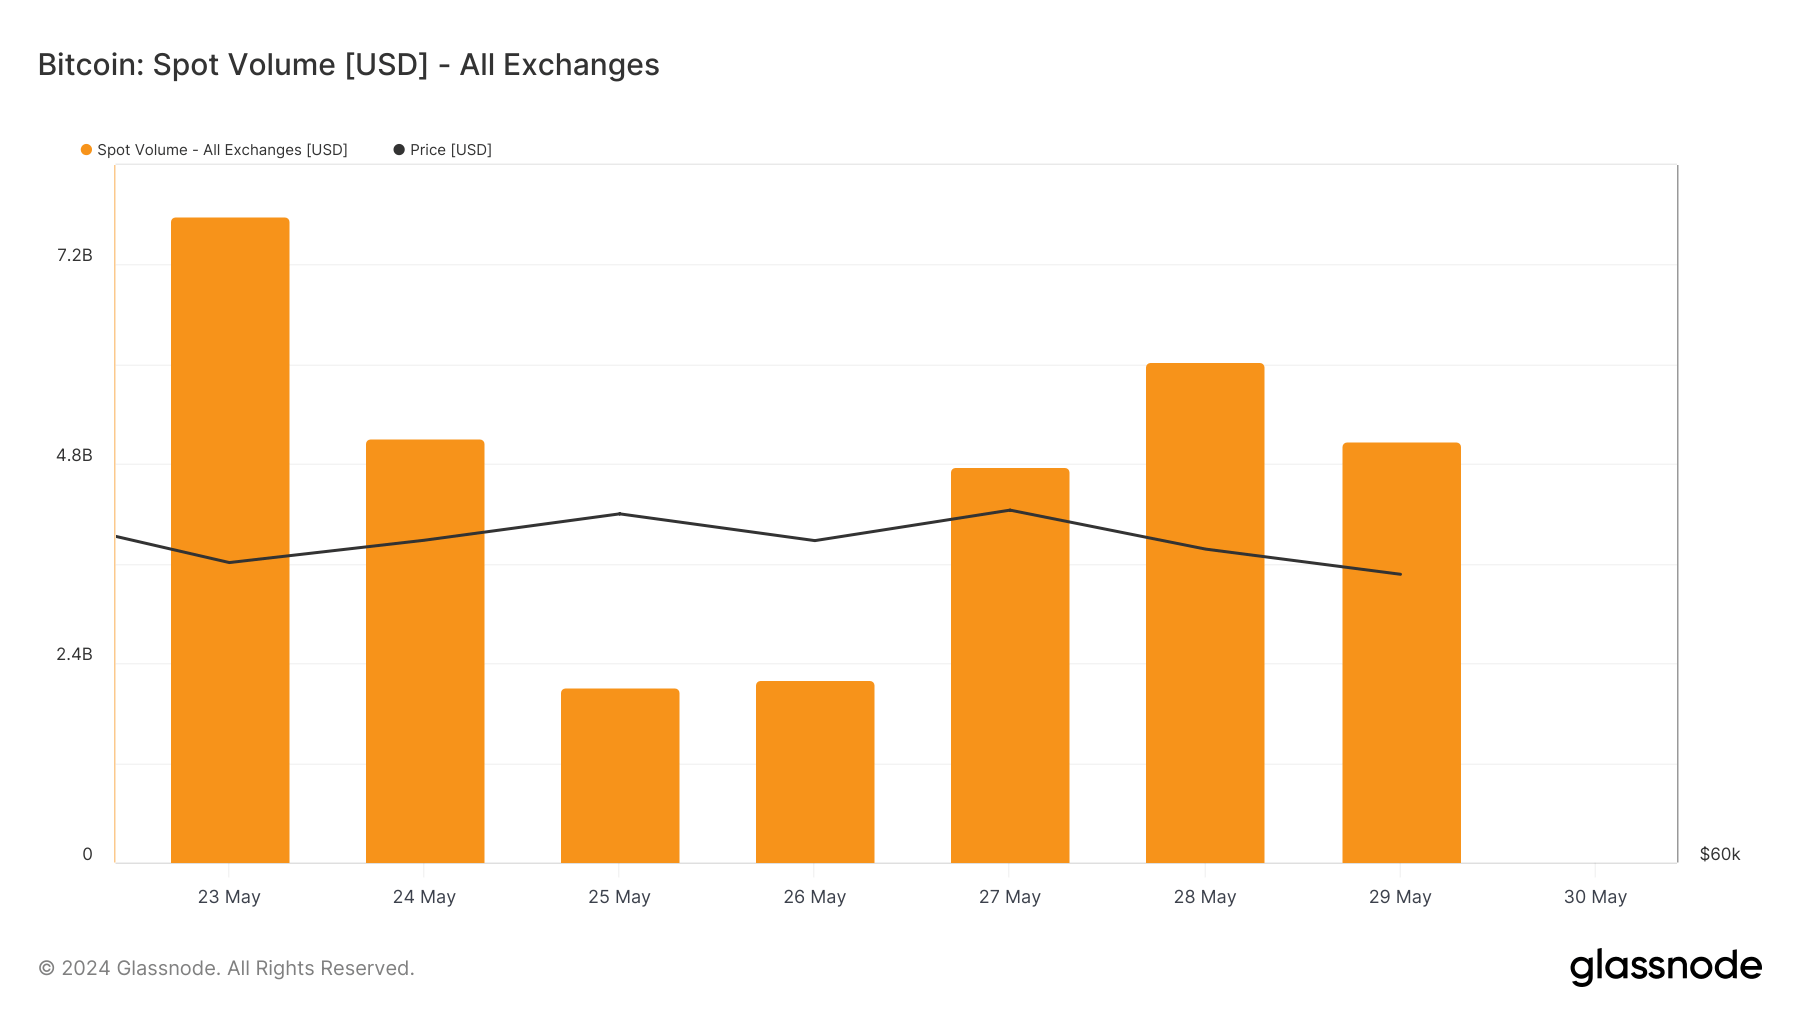
This peak corresponds to the lowest spot trading volume in the past week of $2.121 billion. This shows that the price spike may have reduced trading activity as the market awaited further price movements or reached a point of hesitation.
The intraday spot volume data from Glassnode reveals a sharp decline from May 23, with $7.780 billion, to May 25, with $2.121 billion. This significant drop in volume shows a period of low volatility and a lack of strong market catalysts, leading to a substantial reduction in trading activity.
The following days show a recovery in trading volumes. On May 27, the spot trading volume increased to $4.761 billion as Bitcoin regained $69,385. On May 28, the spot trading volume surpassed $6 billion despite a slight price drop to $68,280.
This pattern suggests that price peaks are not always followed by an immediate increase in trading activity, as traders tend to wait out the consolidation that inevitably occurs after a price increase.
Analyzing the intraday spot buying and selling volumes helps us determine the overall market sentiment. If most of the trading volume comes from selling, it shows a bearish market that’s either rushing to capitalize on sharp price movements and exit or cut its losses.
Conversely, if most of the trading volume comes from buying, the overwhelming sentiment is bullish as the market is racing to enter at current price points, expecting further increases.
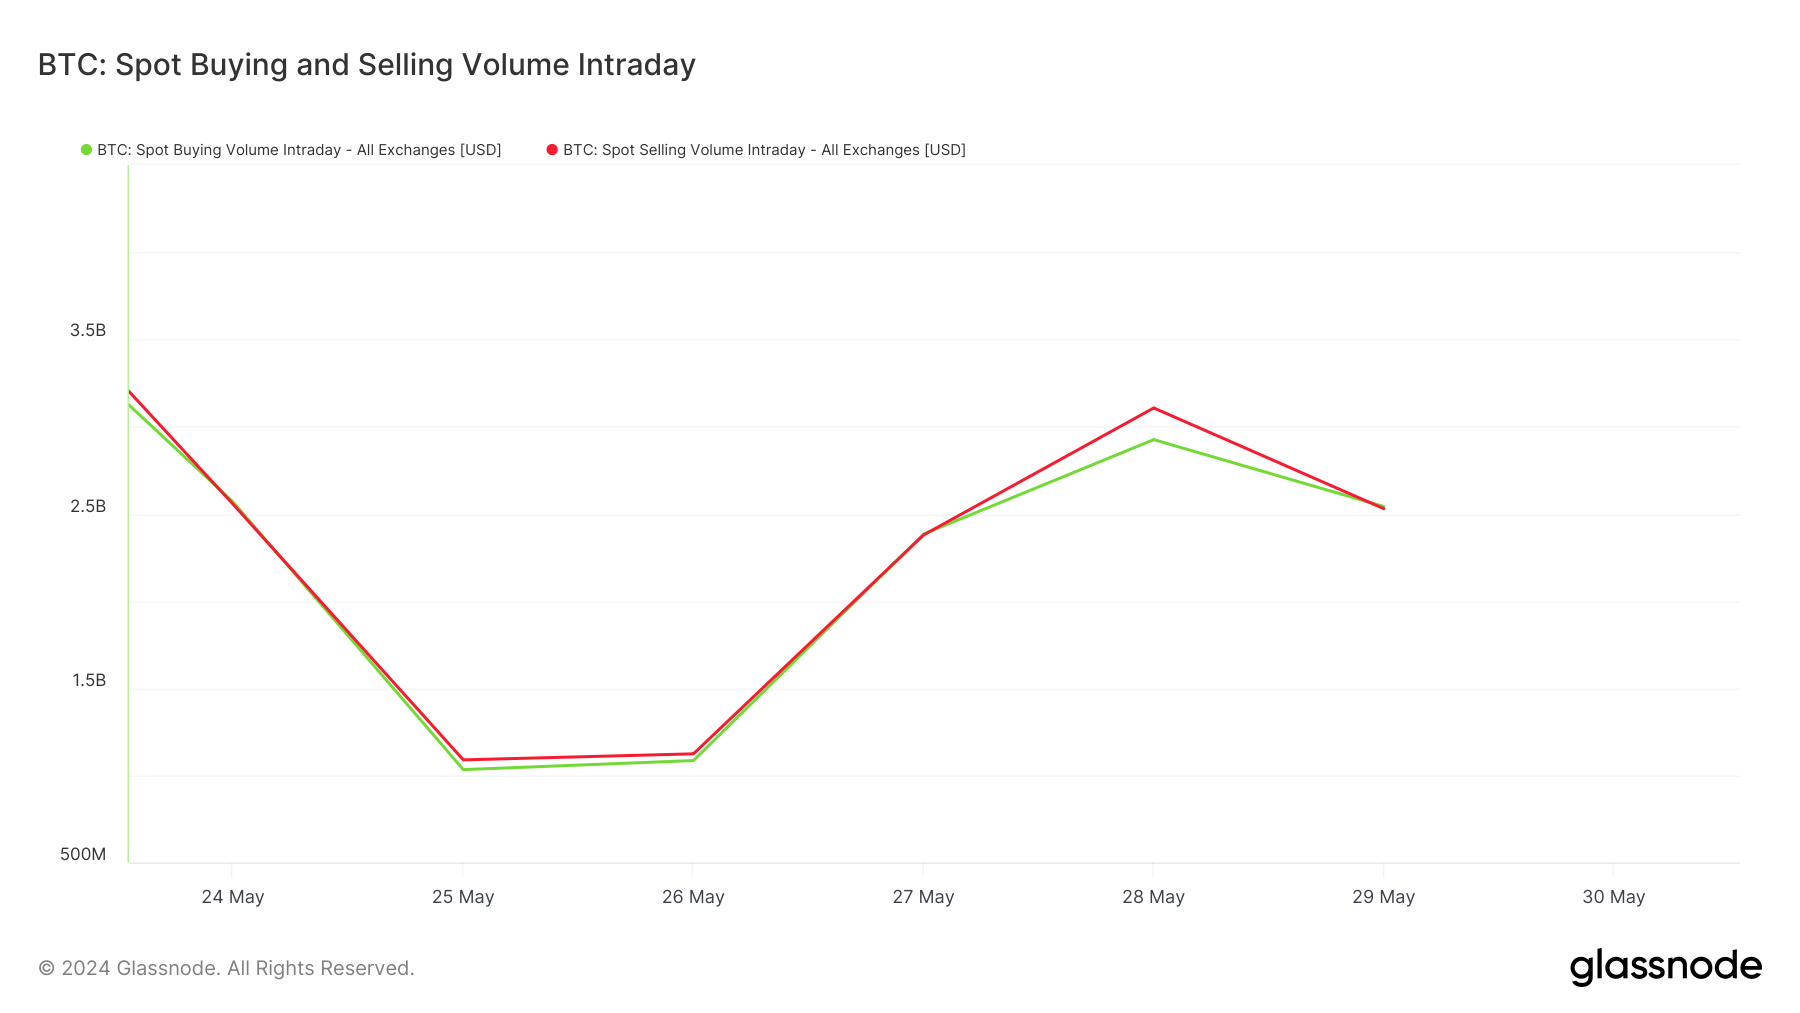
Glassnode’s data from the past week reveals a market that’s almost in equilibrium. On May 23, the buying volume was $3.796 billion against a selling volume of $3.984 billion. While this would usually indicate a bearish sentiment, having these volumes so close together shows a split market with no clear directional bias.
This trend continued throughout the past week. May 24 saw almost equal buying and selling volumes of around $2.566 billion and $2.553 billion, respectively, while the lowest volumes in May showed buying at $1.032 billion and selling at $1.088 billion.
When trading volume started to pick up on May 27, buying and selling volumes continued to match at around $2.383 billion and $2.378 billion, showing a highly active trading environment with participants engaging equally in buying and selling.
The peak in spot selling volume on May 28 at $3.106 billion, compared to buying volume at $2.924 billion, suggests a slight bearish sentiment, possibly influenced by the price drop to $68,280, as traders took advantage of the price movements to sell off holdings.
Looking at the spot volumes across exchanges shows Binance consistently leading, followed by Bybit and Coinbase. On May 26, Binance had $866.776 million in volume, which increased significantly to $2.236 billion by May 28. Bybit and Coinbase also showed an increase in volumes, with Bybit peaking at $1.550 billion on May 27 and Coinbase at $774.203 million on May 28.
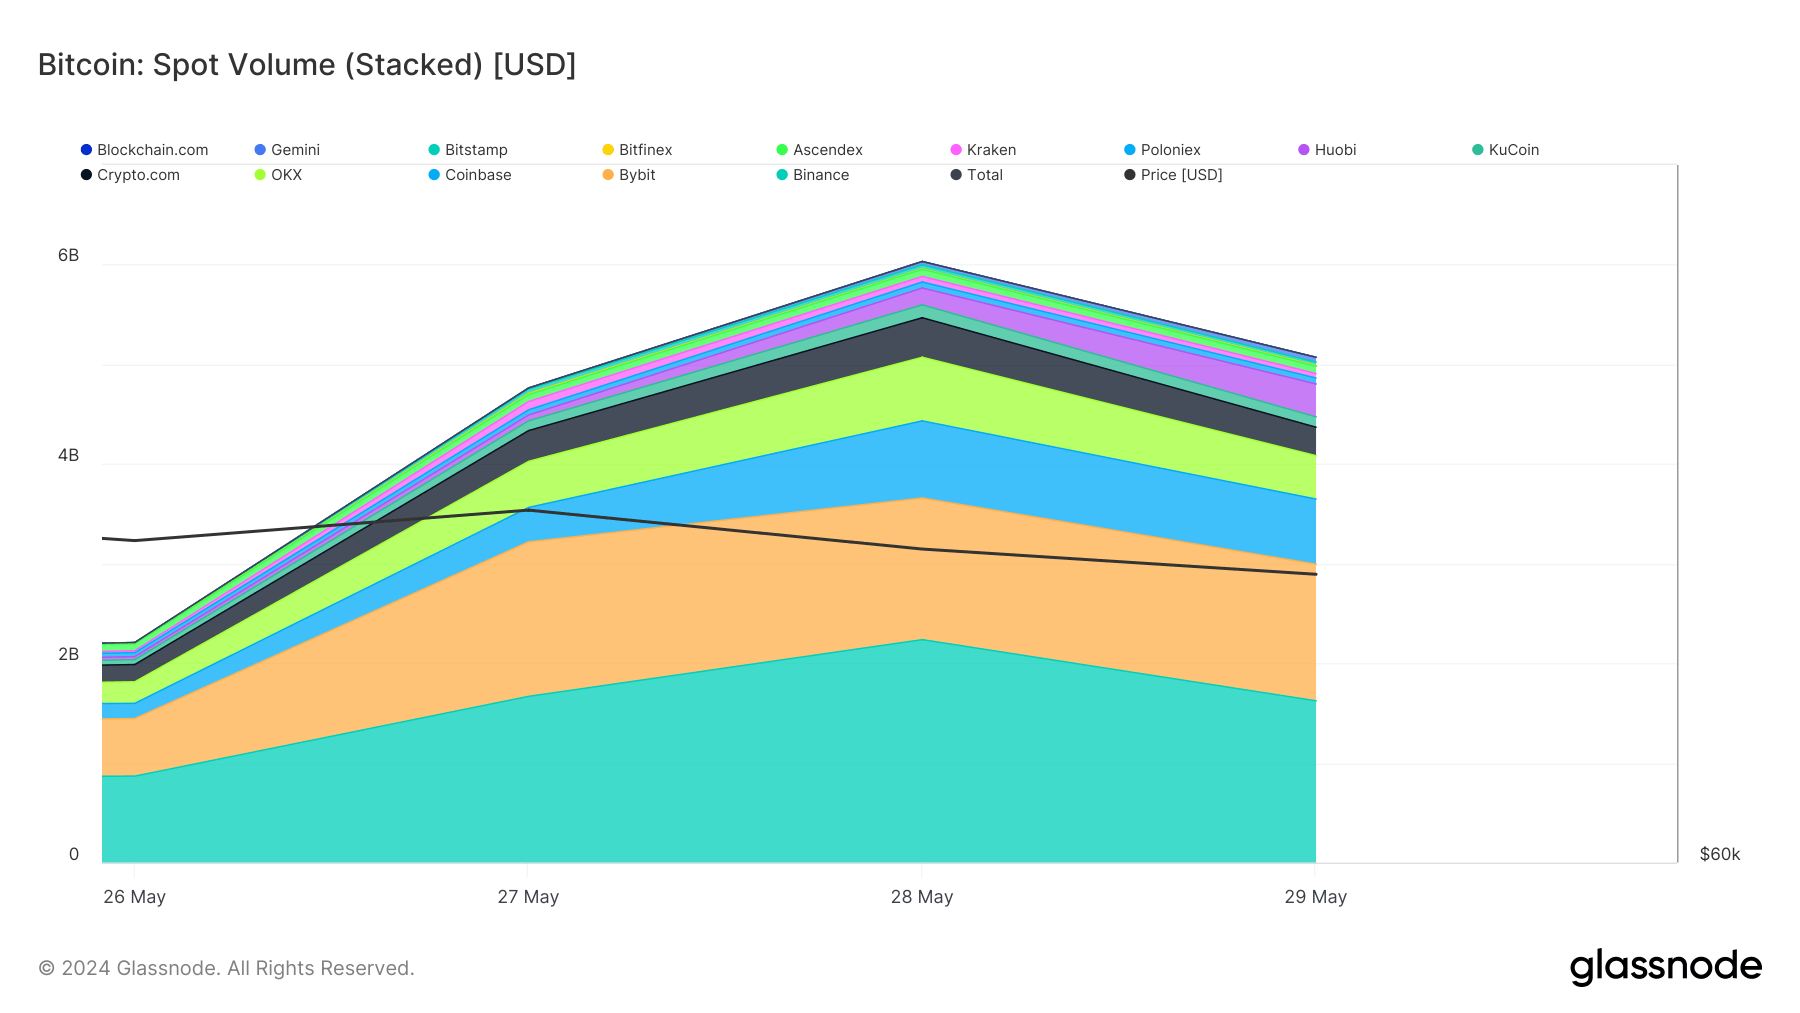
The significantly higher volumes on Binance, which often surpassed the combined volume of Bybit and Coinbase, can be attributed to its large user base and low trading fees, making it the preferred exchange for high-volume traders.
The balance between buying and selling volumes seen over the past week indicates that the market is indecisive and volatile.
The post Bitcoin market split as buying and selling volumes remain the same appeared first on CryptoSlate.


