BNB price is struggling to stay above the $500 support zone. The price could gain bearish momentum if there is a close below the $500 support.
- BNB price started a fresh decline from the $540 resistance zone.
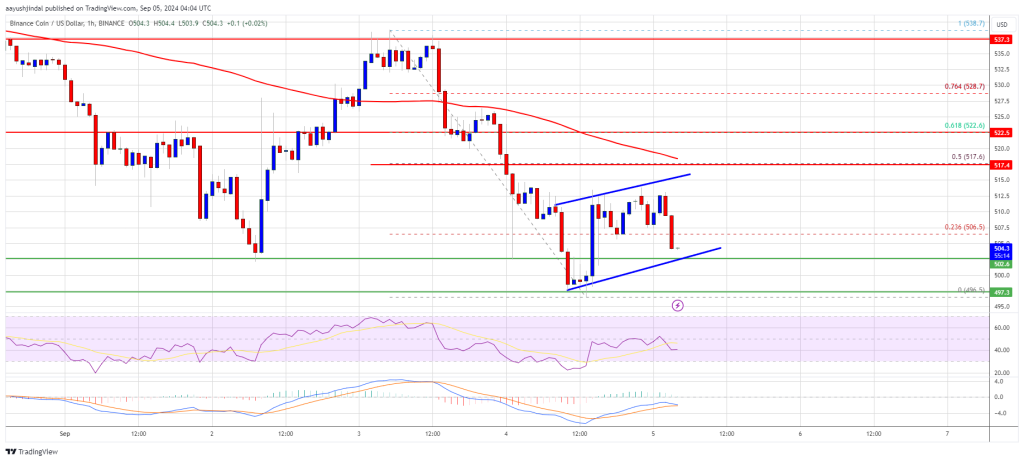
- The price is now trading below $520 and the 100-hourly simple moving average.
- There is a short-term rising channel forming with support at $500 on the hourly chart of the BNB/USD pair (data source from Binance).
- The pair could gain bearish momentum if it settles below the $500 support zone.
BNB Price Dips Again
After struggling to test the $540 resistance, BNB price started a fresh decline like Ethereum and Bitcoin. The price declined below the $532 and $520 support levels. There was also a move below $510.
Finally, the price found support at $495. A low was formed at $496 and the price is now consolidating losses. There is also a short-term rising channel forming with support at $500 on the hourly chart of the BNB/USD pair. The pair is now trading below $525 and the 100-hourly simple moving average.
If there is a recovery wave, the price could face resistance near the $518 level. It is close to the 50% Fib retracement level of the downward move from the $538 swing high to the $496 low.
The next resistance sits near the $522 level or the 61.8% Fib retracement level of the downward move from the $538 swing high to the $496 low. A clear move above the $522 zone could send the price higher. In the stated case, BNB price could test $535.
A close above the $535 resistance might set the pace for a larger increase toward the $540 resistance. Any more gains might call for a test of the $550 level in the near term.
More Downsides?
If BNB fails to clear the $522 resistance, it could start another decline. Initial support on the downside is near the $500 level. The next major support is near the $496 level.
The main support sits at $488. If there is a downside break below the $488 support, the price could drop toward the $465 support. Any more losses could initiate a larger decline toward the $450 level.
Technical Indicators
Hourly MACD – The MACD for BNB/USD is gaining pace in the bearish zone.
Hourly RSI (Relative Strength Index) – The RSI for BNB/USD is currently below the 50 level.
Major Support Levels – $500 and $496.
Major Resistance Levels – $518 and $522.


