Bitcoin is trading above the $104,000 level after posting its second-highest weekly close in history, reinforcing the strength of the current uptrend. The bullish momentum has been building steadily over the past few weeks, with price surging aggressively after reclaiming both the $90K and $100K psychological levels. This marks a significant shift in sentiment after months of consolidation and market hesitation.
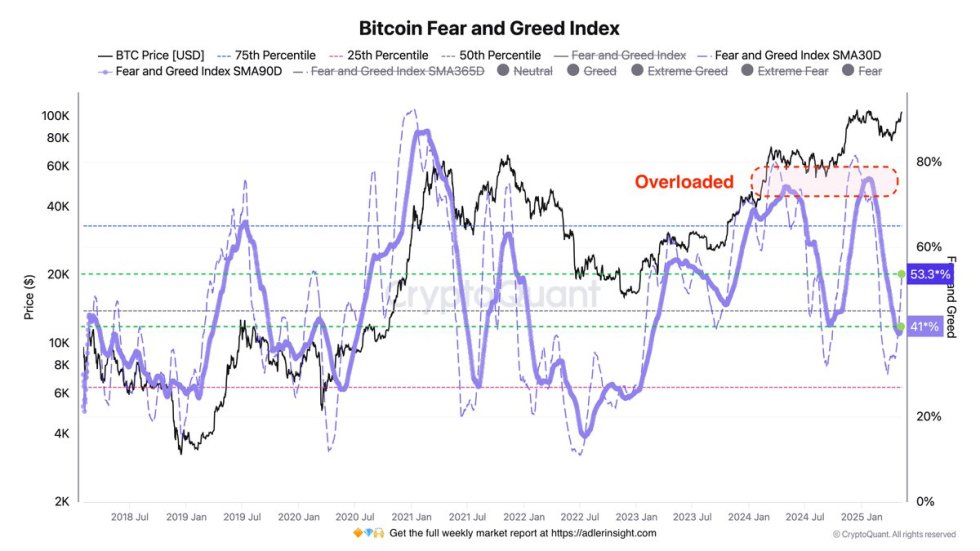
According to data from CryptoQuant, the Fear and Greed Index has started to rise significantly, reflecting growing optimism among Bitcoin investors. While sentiment is clearly leaning bullish, the index still remains well below the euphoric “overload” zone, suggesting there’s more room for upside before reaching overheated conditions.
This combination of strong price action and controlled sentiment could indicate a sustainable rally rather than a speculative blow-off. As Bitcoin holds above key resistance zones, analysts and investors are beginning to focus on the all-time high near $109K as the next major target. The recent move has also energized the broader crypto market, with altcoins gaining strength alongside Bitcoin. As momentum builds, the market appears poised to enter a new phase of expansion, fueled by renewed confidence and capital inflows.
Momentum Builds As Bitcoin Eyes $109K All-Time High
Bitcoin is entering a critical week as bulls set their sights on the $109,000 all-time high. After months of heavy selling pressure and widespread market doubt, the leading cryptocurrency has surged back into the spotlight, trading just below the $105,000 mark. This level now acts as immediate resistance and could become a major pivot in the coming sessions. If bulls manage to push through this barrier, a breakout into uncharted territory would be imminent. However, if selling pressure intensifies around this zone, Bitcoin could face a period of consolidation or retracement before making another attempt.
Market sentiment has notably improved, as highlighted by top analyst Axel Adler. According to Adler’s insights, the current average values of the Fear and Greed Index are climbing steadily, signaling a rise in investor confidence. Importantly, the index remains far from extreme greed territory, which suggests that optimism is building but not yet overheated — a constructive sign for a sustainable rally.
Further fueling the positive outlook are macro developments. Sunday’s negotiations between Washington and Beijing brought a sense of relief to global markets, contributing to the broader upswing. With geopolitical tensions easing and Bitcoin holding its ground near multi-month highs, the setup for another leg higher is taking shape.
BTC Faces A Critical Test Near All-Time Highs
Bitcoin is trading above $104,000, following the second-highest weekly close in its history. After reclaiming the $90K level in late April, the price surged aggressively and now hovers just below the all-time high (ATH) zone. This weekly chart shows clear momentum, with BTC pushing through key resistance zones with high volume and conviction. However, price is now directly testing the same range that marked the top earlier this year—between $104K and $105.7K.

This zone is crucial. If bulls can push above this level and close the weekly candle near or above the current all-time high, it would likely confirm the long-term uptrend. Such a breakout would put BTC in price discovery, potentially triggering momentum-driven buying and institutional inflows. On the other hand, if Bitcoin stalls or retraces from here, it could signal a short-term exhaustion and possibly a correction toward the $100K–$103K support zone.
Volume trends and market sentiment remain favorable, especially with declining exchange balances and rising investor optimism. However, a confirmed weekly breakout above the ATH remains the ultimate confirmation for the next macro leg up. All eyes are now on whether BTC can make history with a new all-time high this week.
Featured image from Dall-E, chart from TradingView


