Bitcoin price failed to recover above $96,500. BTC is down over 3% and there are chances of more downsides below $92,000.
- Bitcoin started a fresh decline below $95,000 and $94,500.
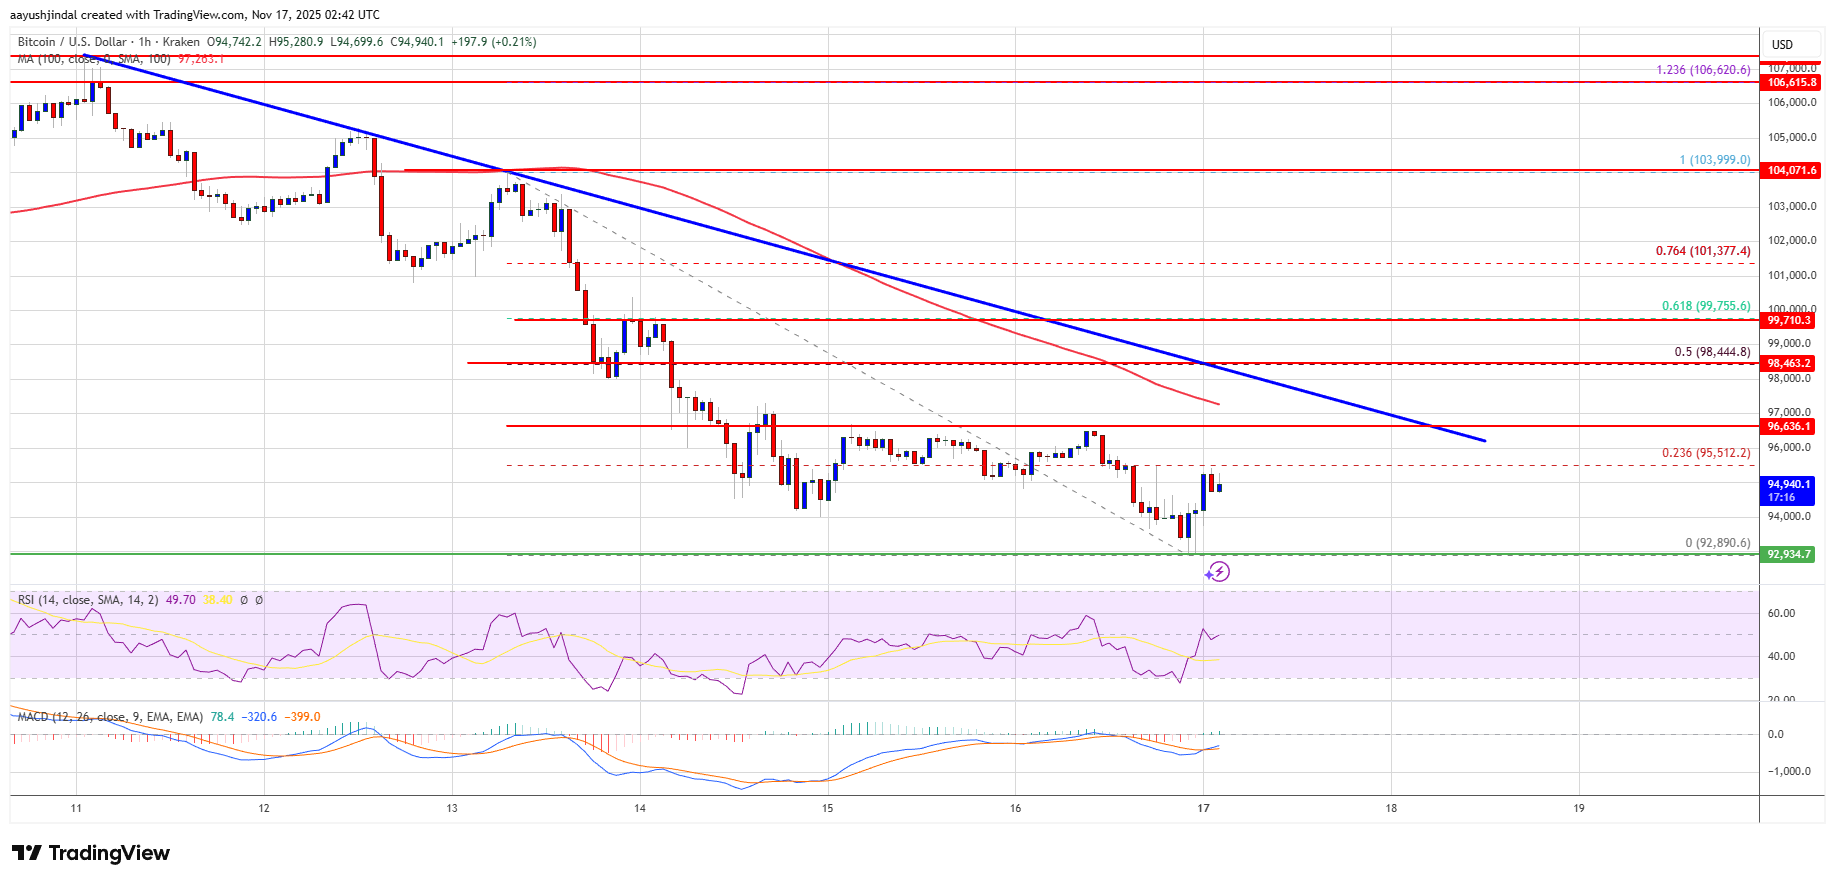
- The price is trading below $98,000 and the 100 hourly Simple moving average.
- There is a bearish trend line forming with resistance at $96,600 on the hourly chart of the BTC/USD pair (data feed from Kraken).
- The pair might continue to move down if it settles below the $92,500 zone.
Bitcoin Price Dips Further
Bitcoin price failed to stay in a positive zone above the $95,500 pivot level. BTC bears remained active below $95,500 and pushed the price lower.
The bears gained strength and were able to push the price below the $94,000 zone. A low was formed at $92,890 and the price is now consolidating losses near the 23.6% Fib retracement level of the recent decline from the $103,998 swing high to the $92,890 low.
Bitcoin is now trading below $95,000 and the 100 hourly Simple moving average. Besides, there is a bearish trend line forming with resistance at $96,600 on the hourly chart of the BTC/USD pair.
If the bulls attempt another recovery wave, the price could face resistance near the $95,500 level. The first key resistance is near the $96,500 level and the trend line. The next resistance could be $97,200. A close above the $97,200 resistance might send the price further higher. In the stated case, the price could rise and test the $98,500 resistance. Any more gains might send the price toward the $99,500 level. The next barrier for the bulls could be $100,000 and $100,500.
More Losses In BTC?
If Bitcoin fails to rise above the $96,600 resistance zone, it could start another decline. Immediate support is near the $93,500 level. The first major support is near the $92,500 level.
The next support is now near the $91,500 zone. Any more losses might send the price toward the $90,000 support in the near term. The main support sits at $88,500, below which BTC might accelerate lower in the near term.
Technical indicators:
Hourly MACD – The MACD is now gaining pace in the bearish zone.
Hourly RSI (Relative Strength Index) – The RSI for BTC/USD is now below the 50 level.
Major Support Levels – $92,500, followed by $90,000.
Major Resistance Levels – $95,500 and $96,600.


