Bitcoin is showing signs of recovery after enduring weeks of selling pressure that culminated in a sharp flash crash on October 10, when the price briefly dipped to around $103,000. Since then, BTC has rebounded modestly, now testing resistance near $111,000, a zone where sellers have historically stepped in. Despite the bounce, market sentiment remains fragile, with traders hesitant to call a clear bottom.
According to top analyst Darkfost, Bitcoin may be entering a new phase of disbelief — a stage often seen at the end of major corrections, when investors struggle to trust any sign of recovery. This shift is becoming increasingly evident in the derivatives market, particularly through funding rates, which reflect trader positioning and market bias.
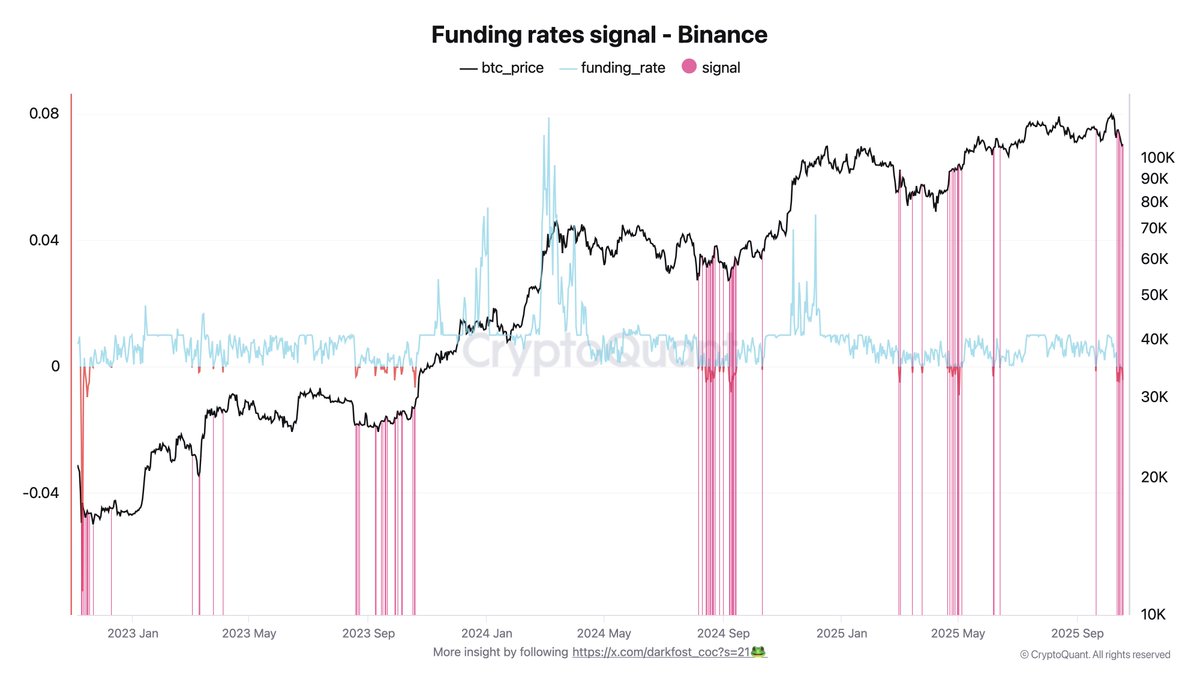
On Binance, which still dominates global futures trading volume, funding rates have remained negative for six of the past seven days, currently sitting around -0.004%. This sustained bearish bias suggests that short positions continue to outweigh longs, as traders remain cautious after the recent liquidation wave. Historically, such persistent disbelief and short dominance have often preceded strong short squeezes or relief rallies.
Disbelief Could Set The Stage for The Next Big Rally
According to Darkfost, the current phase of disbelief could paradoxically become the foundation for Bitcoin’s next major rally. When traders remain overly bearish despite early signs of recovery, the accumulation of short positions can create a setup for a powerful short squeeze. In such scenarios, even a modest upward move can force short sellers to cover their positions, accelerating buying pressure and fueling a rapid price breakout.
If the current uptrend continues to build momentum, this wave of liquidations could push Bitcoin sharply higher. Darkfost points to key liquidity zones around $113,000 and $126,000, both areas where significant short positions are currently concentrated. As these positions unwind, BTC could see a chain reaction of forced buying — a dynamic that has historically triggered explosive moves.
Similar patterns have unfolded before. In September 2024, Bitcoin fell to $54,000 before rebounding above $100,000 for the first time, fueled by a large-scale short squeeze. Again, in April 2025, BTC surged from $85,000 to $111,000, and eventually to $123,000, following the same structure.
Darkfost suggests the market could now be entering another such phase of disbelief, where widespread skepticism masks underlying strength. If history rhymes, this doubt-driven environment may once again transform fear into momentum — setting the stage for Bitcoin’s next major move higher.
Bitcoin Finds Short-Term Support, Eyes $113K Resistance
Bitcoin is showing signs of stabilization after a volatile week, rebounding from its recent low near $106,000 to trade around $111,200. The chart shows BTC reclaiming short-term momentum, with buyers stepping in near the 200-day moving average (red line), a key long-term support zone that has historically marked accumulation phases during corrections.

However, BTC now faces a significant test ahead. The 50-day (blue) and 100-day (green) moving averages are converging near $114,000–$115,000, creating a dense resistance cluster. A successful breakout above this region would signal renewed strength and potentially open the path toward $117,500, the next major liquidity area and psychological barrier for bulls.
On the downside, failure to hold above $110,000 could expose BTC to renewed selling pressure, potentially retesting $106,000 or even the $103,000 level reached during the October 10 flash crash. The current structure suggests that the market is still in a recovery and disbelief phase, where traders remain cautious despite improving price action.
For now, the key focus is on whether BTC can sustain momentum above the 200-day moving average. A confirmed daily close above $113,000 would strengthen bullish confidence and validate the start of a potential short-term reversal.
Featured image from ChatGPT, chart from TradingView.com


