The Bitcoin price prediction continues sideways movement currently at $28,966 after another significant rejection from $29,239.
Bitcoin Prediction Statistics Data:
- Bitcoin price now – $28,966
- Bitcoin market cap – $552.4 billion
- Bitcoin circulating supply – 19.0 million
- Bitcoin total supply – 19.0 million
- Bitcoin Coinmarketcap ranking – #1
BTC/USD Long-term Trend: Ranging (Daily Chart)
Key levels:
Resistance Levels: $35,000, $37,000, $39,000
Support Levels: $23,000, $21,000, $19,000
Looking at the daily chart, after a serious downtrend, BTC/USD is still flat, and trading sideways but has seen a volatile move, peaking at around $28,966 before quickly dropping to $28,500 below the 9-day and 21-day moving averages. Therefore, one can say that the Bitcoin (BTC) price is likely to continue with sideways movement before dropping below the channel.
Bitcoin Price Prediction: What could be the Next Direction for Bitcoin?
According to the daily chart, the Bitcoin price is trading at $28,966 with a slight gain of 1.29%. However, the prevailing trend is ranging from expanding volatility as the first digital asset continues to consolidate in a bearish flag pattern. Meanwhile, a breakdown from this pattern is supposed to continue in the direction of the previous trend. On the contrary, traders expect BTC/USD to rise above the 9-day and 21-day moving averages before moving towards the potential resistance levels at $35,000, $37,000, and $39,000.
Furthermore, should the Bitcoin price break below the lower boundary of the channel; the price may head towards the $25,000 vital support. A further low drive could send the price to $23,000, $21,000, and $19,000 support. The technical indicator Relative Strength Index (14) is seen moving sideways below the 40-level, which makes the market to be indecisive at the moment.
BTC/USD Medium-Term Trend: Ranging (4H Chart)
On the 4-hour chart, we can see that the bulls are likely to step back into the market, trading within the 9-day and 21-day moving averages. Meanwhile, the $28,000 and below may be visited if BTC/USD breaks below the lower boundary of the channel.
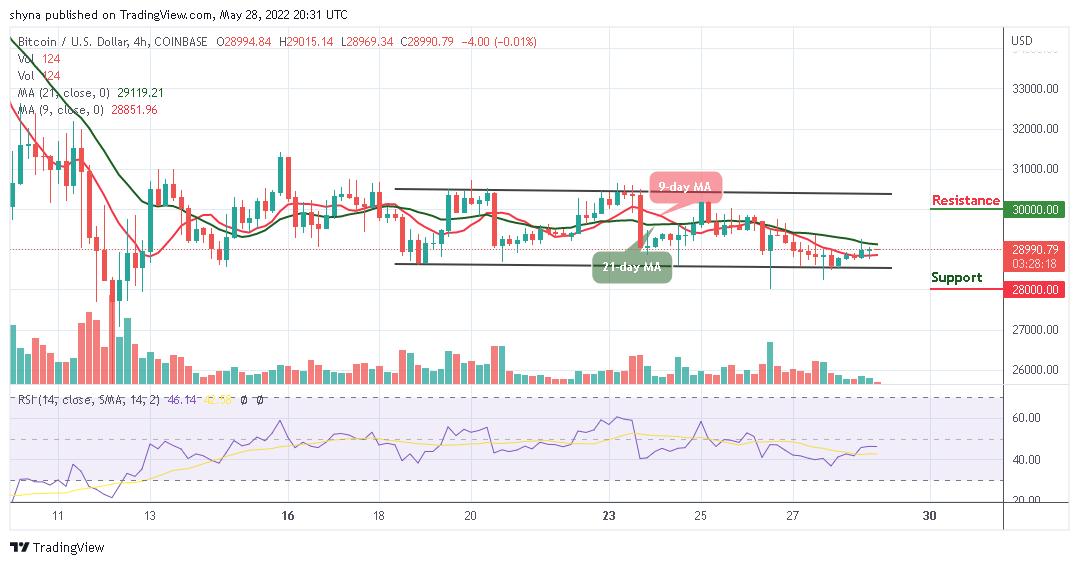
However, if the buyers can push the market to the north, traders may expect a break towards the upper boundary of the channel. Breaking the mentioned barrier may further allow the bulls to touch the resistance level of $30,000 and above, but the technical indicator Relative Strength Index (14) is moving below 50-level, indicating a sideways movement.
eToro – Our Recommended Bitcoin Platform
- Regulated by the FCA, ASIC and CySEC
- Buy Bitcoin with Bank transfer, Credit card, Neteller, Paypal, Skrill
- Free Demo Account, Social Trading Community – 20 Million Users
- Free Bitcoin Wallet – Unlosable Private Key
- Copytrade Winning Bitcoin Traders – 83.7% Average Yearly Profit
Read more:


