Data shows that the Bitcoin Realized Volatility metric has fallen to historically low levels. What generally happens after this pattern forms?
Bitcoin Realized Volatility Has Decline To Extreme Lows Recently
In a post on X, CryptoQuant author Axel Adler Jr has discussed about the latest trend taking place in the Realized Volatility of Bitcoin. The Realized Volatility here refers to an indicator that basically tells us about how volatile a given asset has been based on its price returns within a specified window.
When the value of this metric is high, it means that the asset in question has experienced a large number of fluctuations during the period. On the other hand, the low indicator implies that the price action has been stale for the commodity.
Now, here is a chart that shows the trend in the 1-week Realized Volatility for Bitcoin over the last few years:
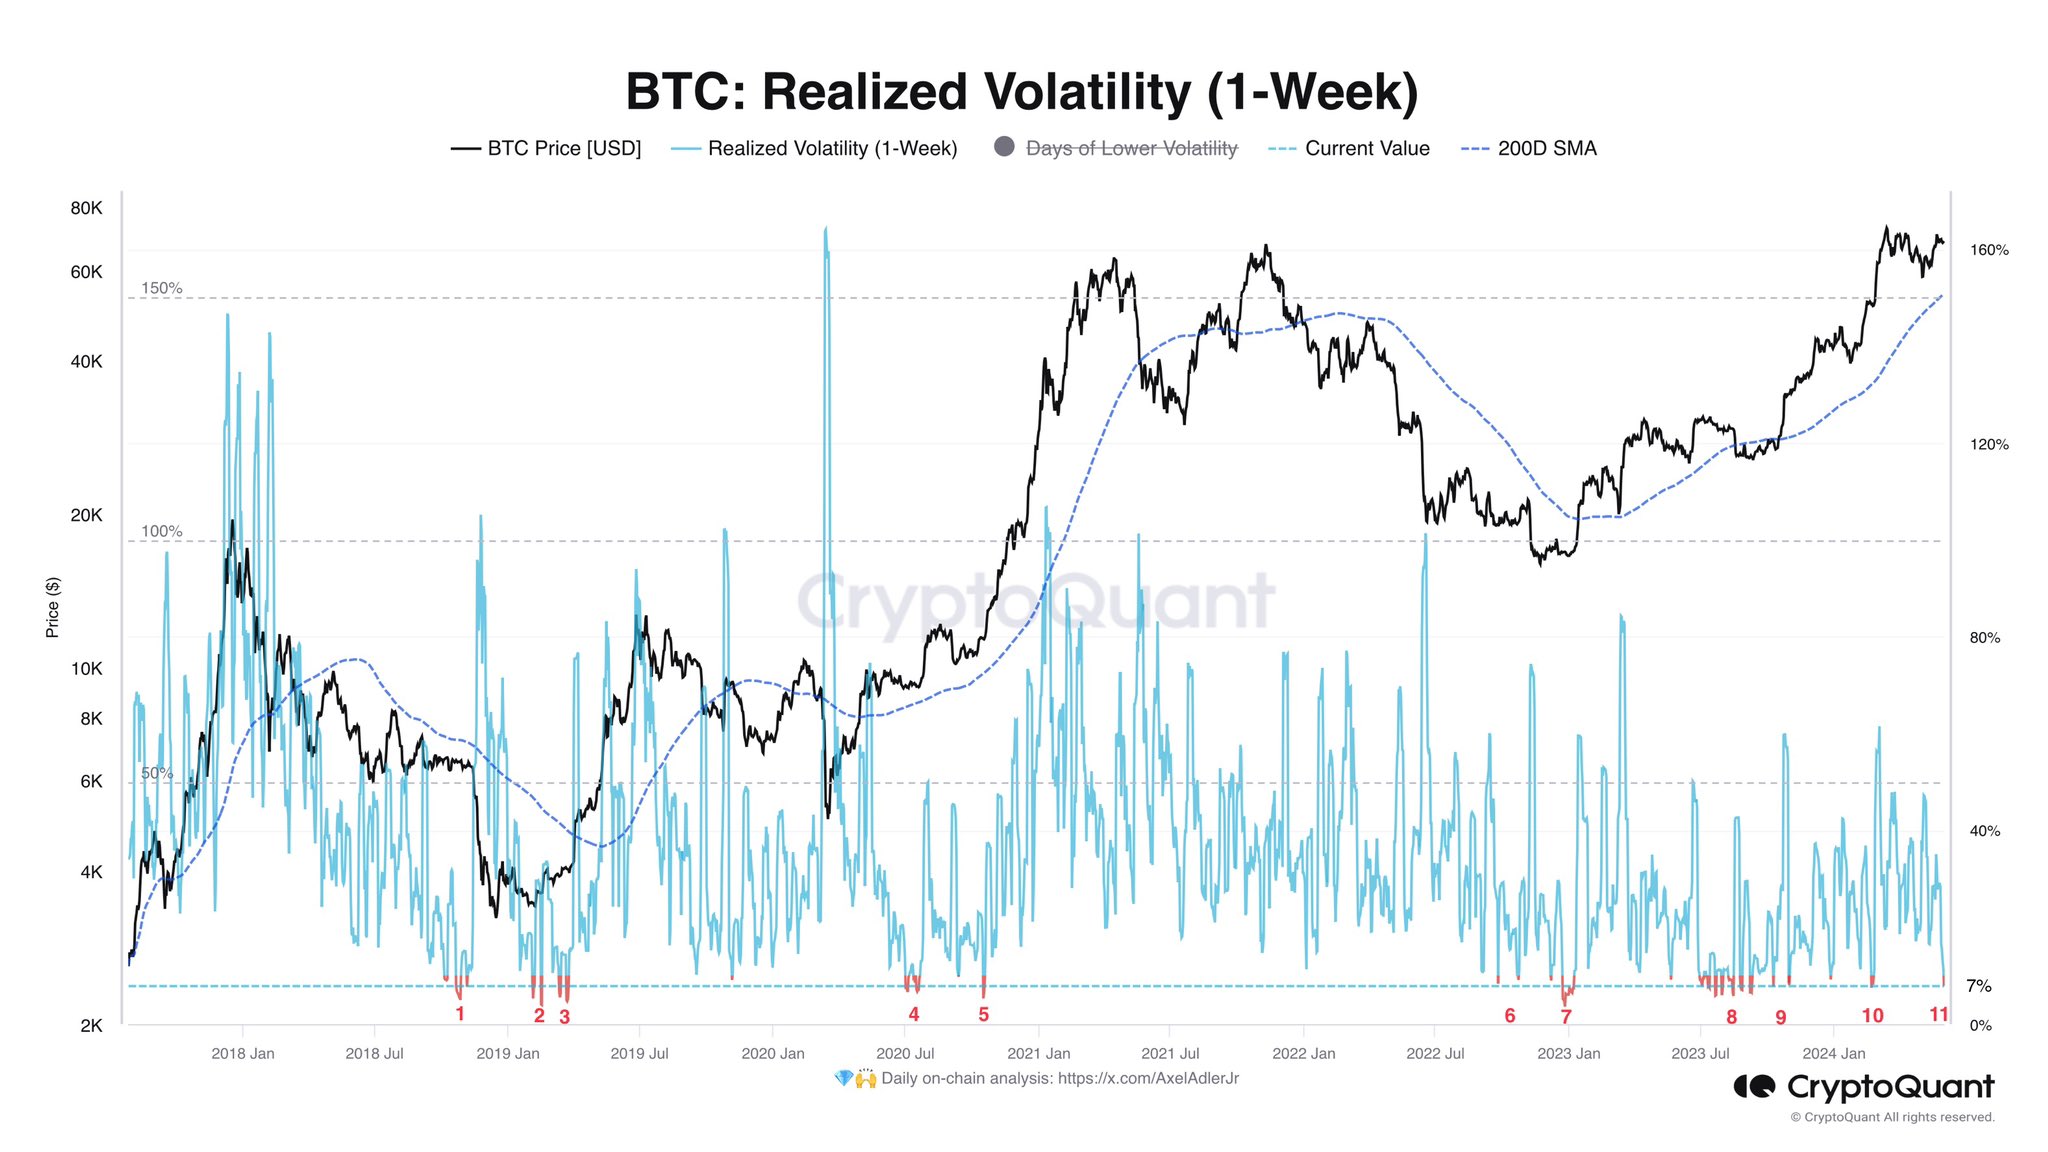
As displayed in the above graph, the 1-week Bitcoin Realized Volatility has declined to pretty low levels of around 7% recently. This is so extreme that only ten other instances in the past six years have seen the metric go similarly low.
This means that the cryptocurrency’s recent consolidation has been amongst the tightest in its history; as for what this trend in the indicator could mean for the cryptocurrency, perhaps past patterns could provide some hints.
An inspection of the chart reveals that such stale price action in the asset has generally unwound with a burst of sharp volatility. The latest instance occurred right before the rally towards the new all-time high (ATH).
Given this pattern, it’s possible that the recent BTC consolidation could also lead to another sharp move for the cryptocurrency. Something to note, however, is that the volatility emerging out of lows in the Realized Volatility has historically gone either way, implying that the price move emerging out of this tight range could very well be a crash.
It remains to be seen how the Bitcoin price will develop from here on out, given the historically stale action it has witnessed over the past week.
In other news, as Axel pointed out in another X post, the recent movement from the bankrupt exchange Mt. Gox has meant that many on-chain indicators have shown false signals.
The analyst has cited the Bitcoin Adjusted Spent Output Profit Ratio (aSOPR) chart as an example.
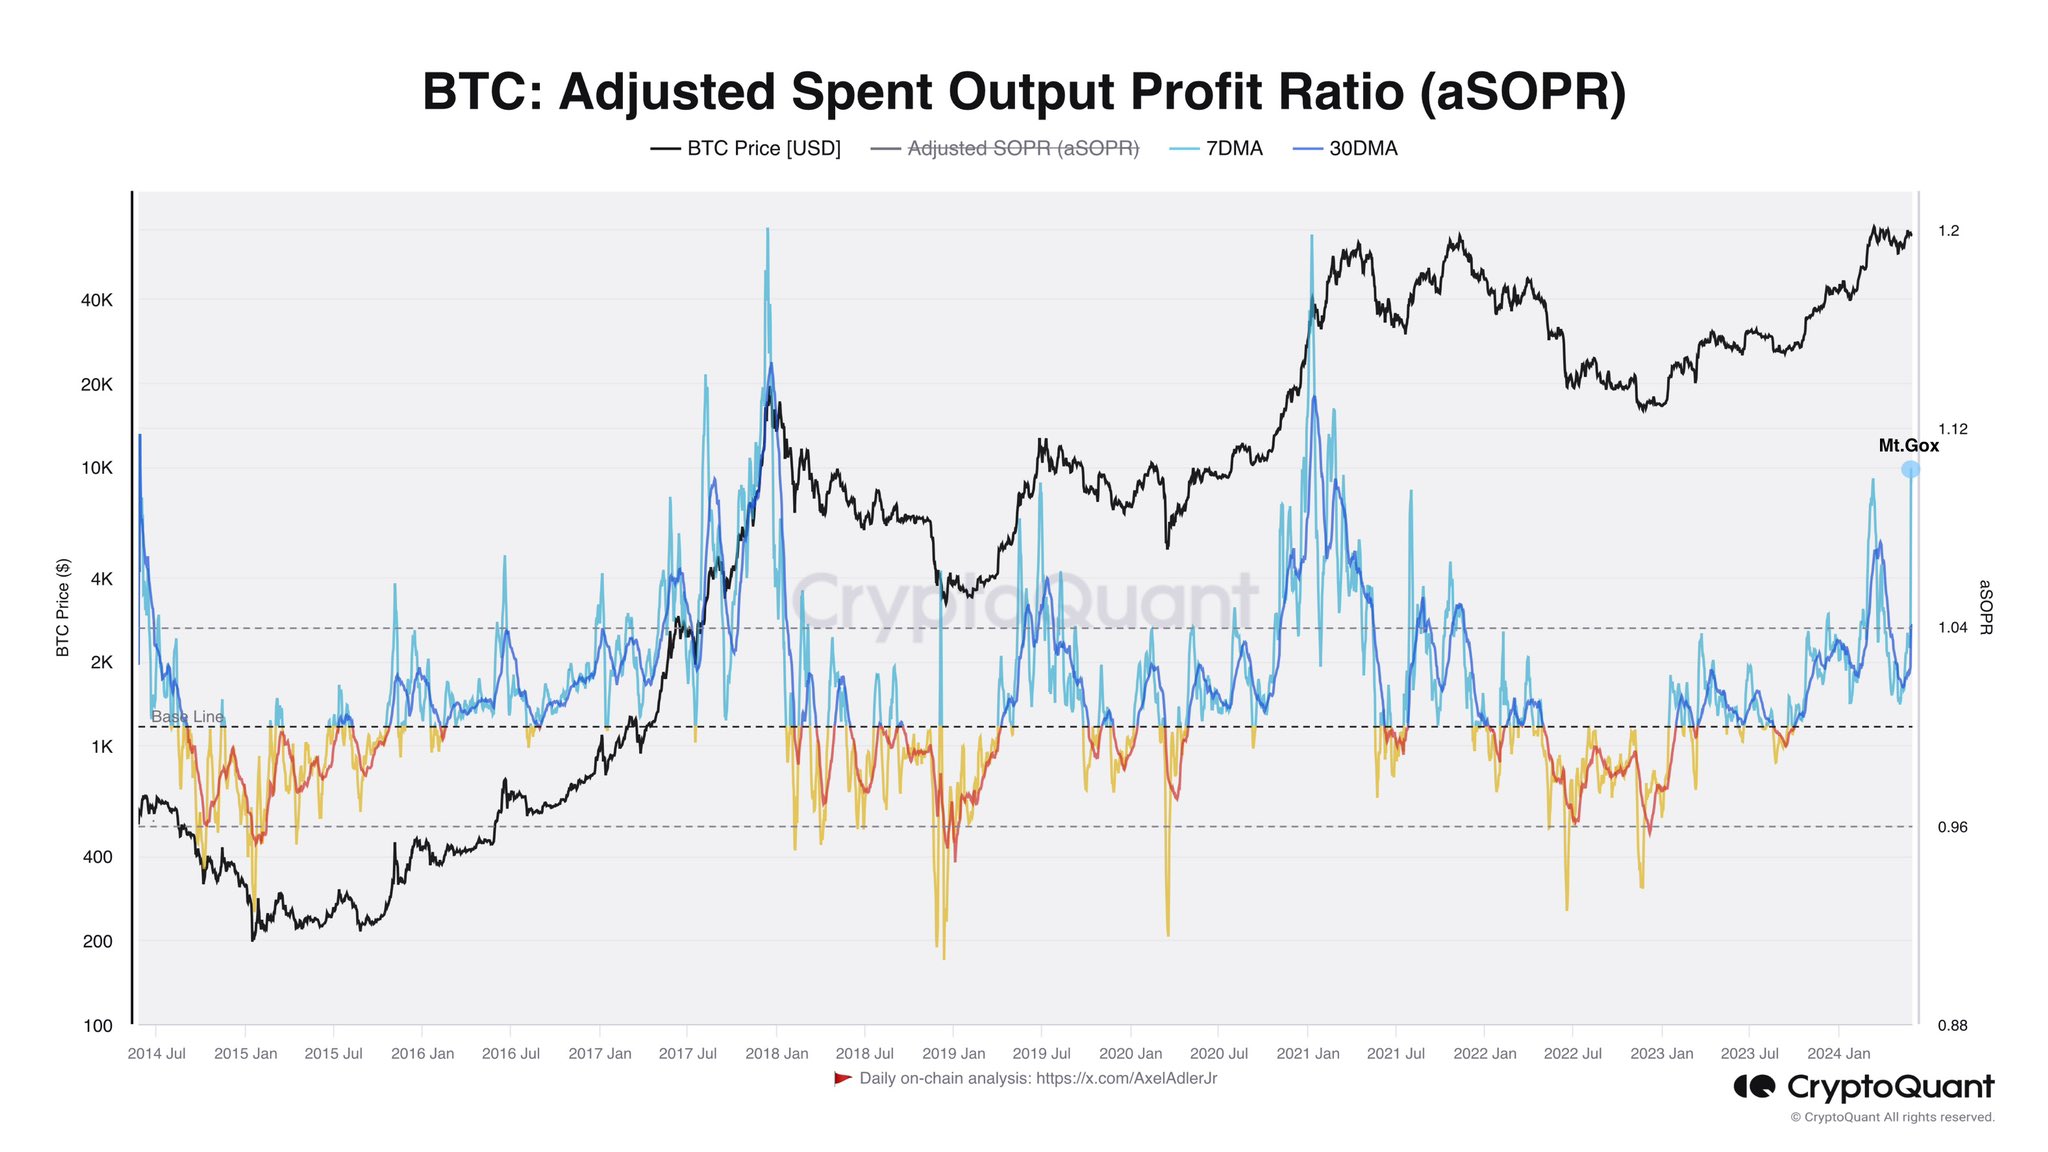
The aSOPR keeps track of the net profit or loss investors across the network realize. As the Mt. Gox BTC had been sitting still in wallets for quite a long time, it’s not surprising that its movement has “realized” a large amount of profit.
Of course, this spike in the indicator isn’t actually a sign of profit-taking, so it’s not a signal that would impact the market.
BTC Price
Bitcoin has declined over the past day as its price is now down to $66,800.


