Ethereum has now entered what looks to be another bearish phase after failing to reclaim a critical level. With all of the technicals pointing toward further downside, it now puts the Ethereum price at risk of crashing back below $4,000, a level which was hard-won by the bulls over the last few months. Most of this has to do with one seemingly simple formation, and that is a Head and Shoulders pattern that shows a downtrend after the pattern is complete.
What This Head And Shoulders Pattern Means For Ethereum Price
Crypto analyst Meliketrader shared a chart on the TradingView website showing the Head and Shoulders pattern that had been completed on the Ethereum 4-hour chart. The chart shows the pattern had begun to appear back in August, with the left shoulder toward the middle of the month. The head would appear close to the end of August, and the right shoulder would complete the formation in mid-September.
Interestingly, following the completion of the Head and Shoulders pattern on the 4-hour chart, the Ethereum price had experienced a large bearish candle, which ended up taking out the neckline. Once this was done, it was a confirmation that the altcoin was at risk of more downside.
The neckline, which lies between $4,200 and $4,400, holds the key here, and since the Ethereum price is, once again, retesting this level, what happens here will determine where the price goes next. In the case of a rejection from here, then the Ethereum price will suffer further crashes.
Such a crash from the neckline would send the price crashing back down below $4,000, since there isn’t much demand there. The analyst places targets around $3,850, calling out a range between $3,700-$3,900 during this time, which is all up to where the neckline is measured. “This level also lines up with the last major resistance zone, so it’s a natural magnet,” Melikatrader said.
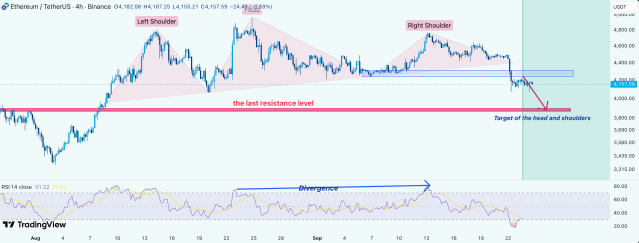
Another development is that the RSI has shown divergence close to the head of the formation. The altcoin has also dropped into the oversold territory at this point, which is a pointer that momentum may be slowing down at this point.
Hope For The Bulls
In the event that the Ethereum price is to turn bullish from here, then there would need to be a successful breakout of the neckline at $4,320 and $4,400. If the altcoin is able to close back above this supply zone with conviction, then the analyst believes that this would invalidate the bearish Head and Shoulder thesis.
The Ethereum price would likely see a significant bounce if this happens, especially given that it is now in oversold territory. Nevertheless, the analyst advises investors to be cautious with sizing and manage risk during this time.


