Solana (SOL) has been experiencing significant volatility and choppy price action since Monday, testing a crucial supply level that will determine its direction in the coming weeks. As the market continues to push higher, most analysts and investors are anticipating a potential surge for SOL, especially with the $160 resistance level appearing to weaken under recent upward pressure.
The crypto community is closely watching these developments, as breaking through this key resistance could lead to substantial gains for the altcoin.
Top analyst and investor Carl Runefelt recently shared a technical analysis that paints an optimistic picture for Solana’s price action in the next few hours. According to Runefelt, the weakening resistance could pave the way for a breakout, with bullish momentum carrying SOL to higher targets.
While the market remains volatile, confidence in Solana’s ability to overcome current challenges is growing. If the supply level is breached, it could mark the start of a new upward trend, making SOL a focal point for traders looking for opportunities in the current market landscape.
The next few days will be critical in shaping Solana’s trajectory, as investors will closely monitor whether the price will confirm the anticipated rally.
Solana Bullish Pattern Signals Momentum
The entire crypto market is experiencing heightened volatility, and Solana has not been immune to it, with its price fluctuating between $148 and $160 since Monday. This consolidation phase has left traders eager to see which direction the altcoin will take in the coming days.
Runefelt recently shared a technical analysis on X, highlighting that Solana is breaking out of a 1-hour Falling Wedge pattern, a bullish signal.
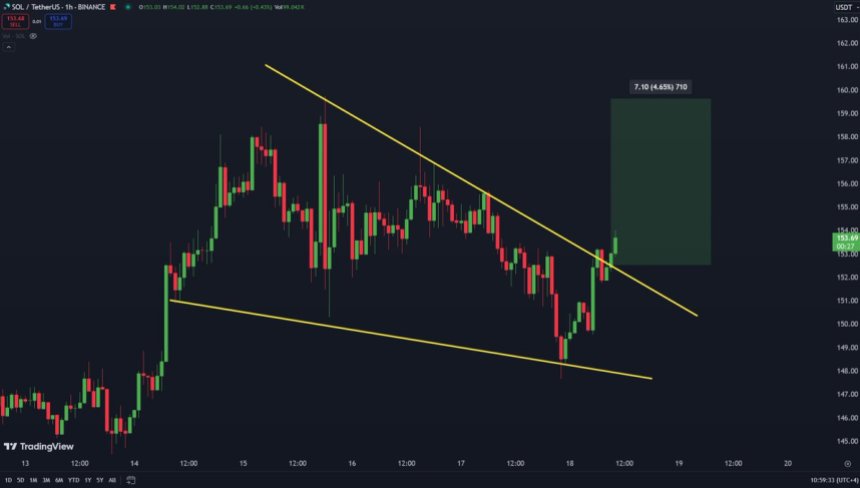
The immediate upside target is $159.6, a level that, if broken and sustained, could lead to a massive surge toward $185—a significant move that would position Solana near its yearly highs.
Despite this bullish setup, the market remains cautious, and there is still the risk that Solana could fail to reclaim key levels. If the price struggles to break and hold above the $159.6 resistance, the current consolidation could persist or even lead to a potential pullback, with downside targets near $148. Such a scenario would disappoint bulls looking for a rally and could dampen market sentiment temporarily.
A confirmed breakout and sustained momentum could signal the beginning of a new bullish phase, attracting both retail and institutional investors.
However, the risk of a failed breakout looms, keeping market participants on edge. Traders are watching closely as Solana’s next move will likely set the tone for its performance over the next few weeks. If it breaks through resistance, SOL could be well on its way to challenging yearly highs.
Technical Levels To Watch
Solana is currently trading at $154 after finding support at the 200-day moving average (MA) at $150.7, a critical level that signals long-term strength if it holds as a demand zone. This MA has historically acted as a key indicator for market trends, and holding above it would reinforce the bullish outlook for SOL.
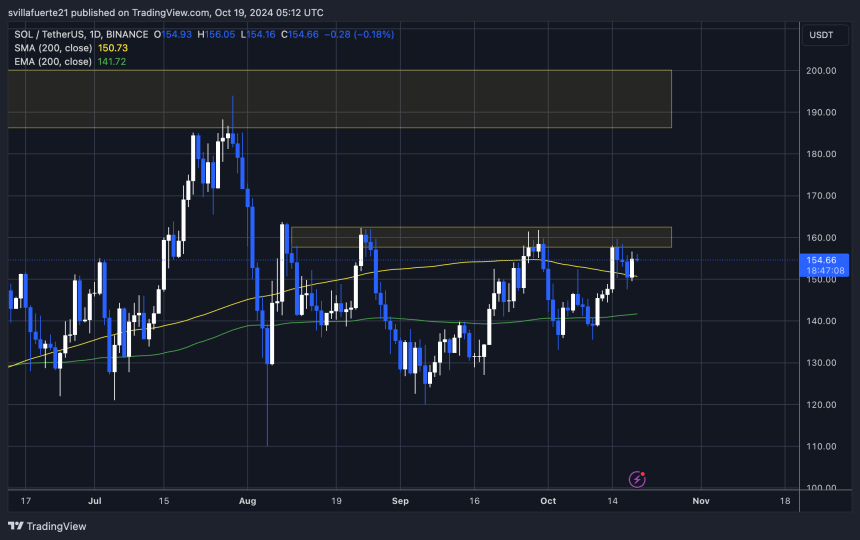
For bulls to maintain momentum, the price must stay above the 200-day MA and push to break the crucial $160 resistance, a level that has capped Solana’s upward movement since early August. Breaking through this resistance would signal a potential surge in price, opening the door to further gains in the coming weeks.
However, if SOL fails to hold above the 200-day MA and cannot overcome the $160 resistance, it risks a corrective move. A drop below the 1D 200 MA could lead to a decline toward $140, a level that will play a pivotal role in determining the next phase of Solana’s price action.
Bulls and bears alike are closely watching these key levels, as the next move could set the tone for Solana’s performance in the near term.
Featured image from Dall-E, chart from TradingView


