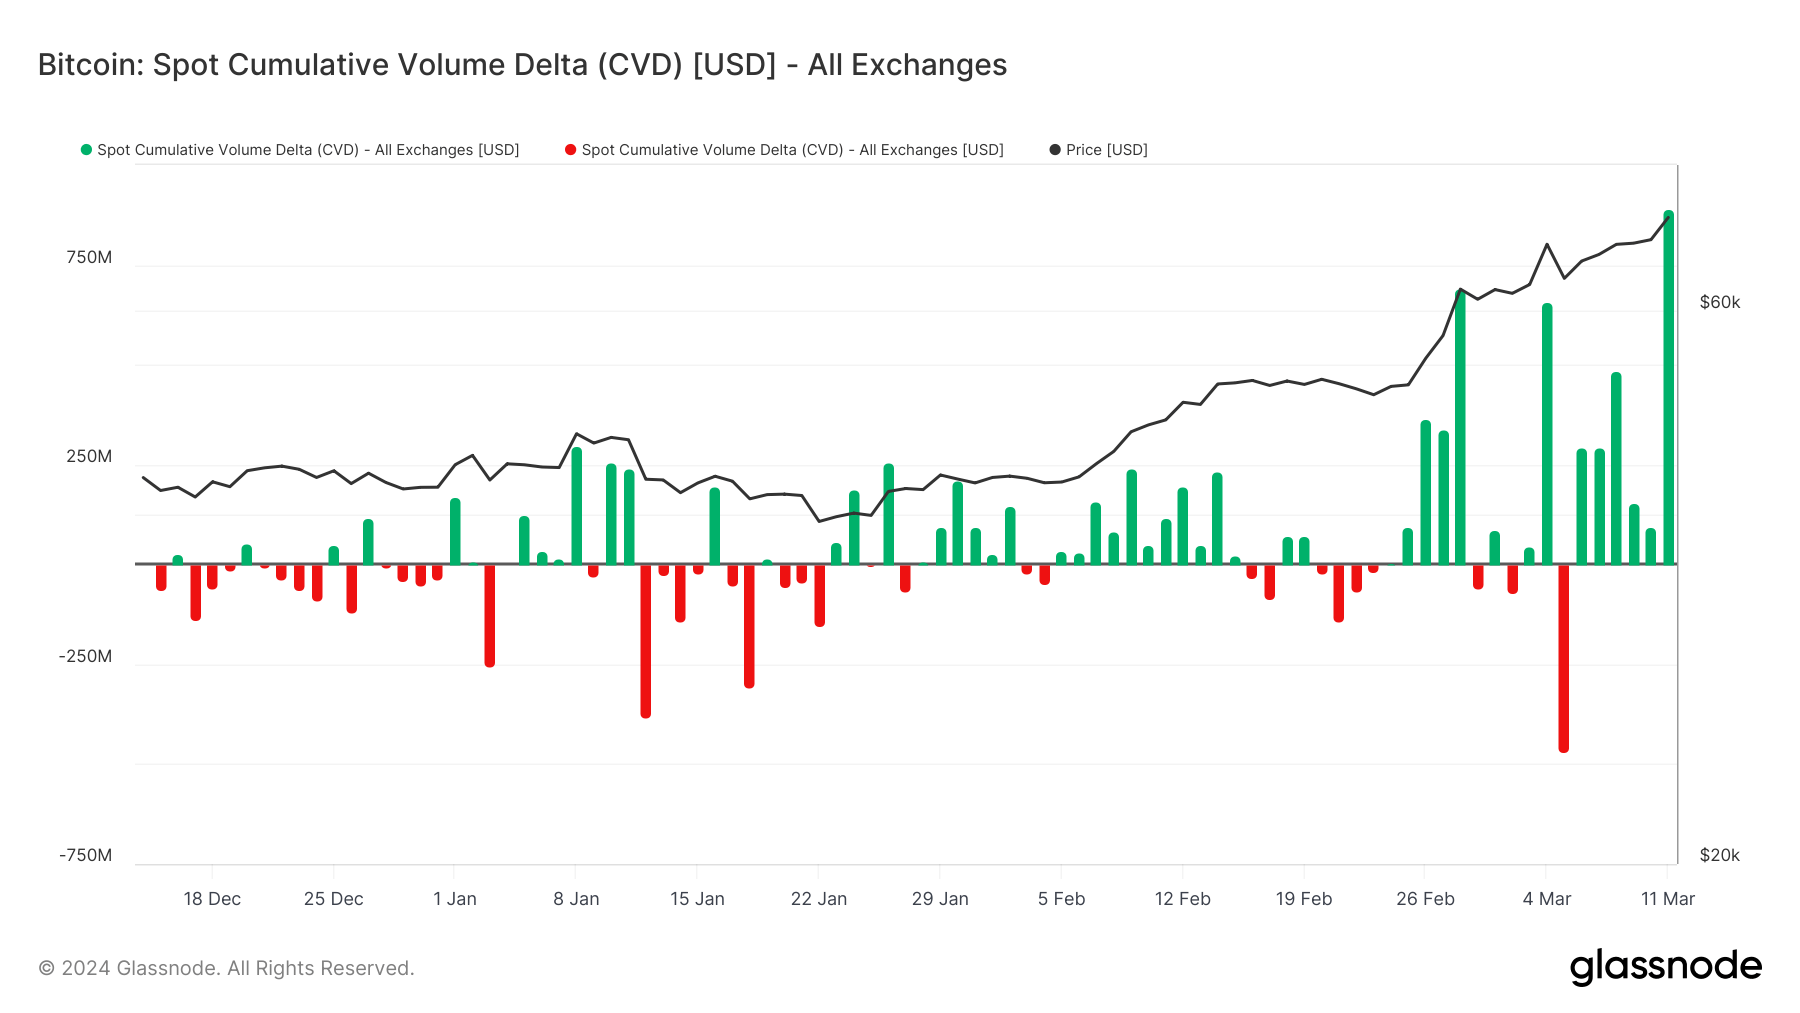
Glassnode’s Bitcoin Spot Cumulative Volume Delta (CVD) registered its highest reading of 2024 on March 11, hitting nearly $900 million. This surge in the CVD, which measures the net difference between aggressive buying and selling pressure across major crypto exchanges, signals a strong bullish sentiment in the Bitcoin market.
Looking at the hourly data, a surge of over $360 million occurred around 7 am UTC as Bitcoin rose from $68,500 to $71,200 in the span of 3 hours. The remaining purchases occurred mostly before 8 pm UTC, with around $70 million in selling pressure occurring around 10 am, then again later at 3 am on March 12.
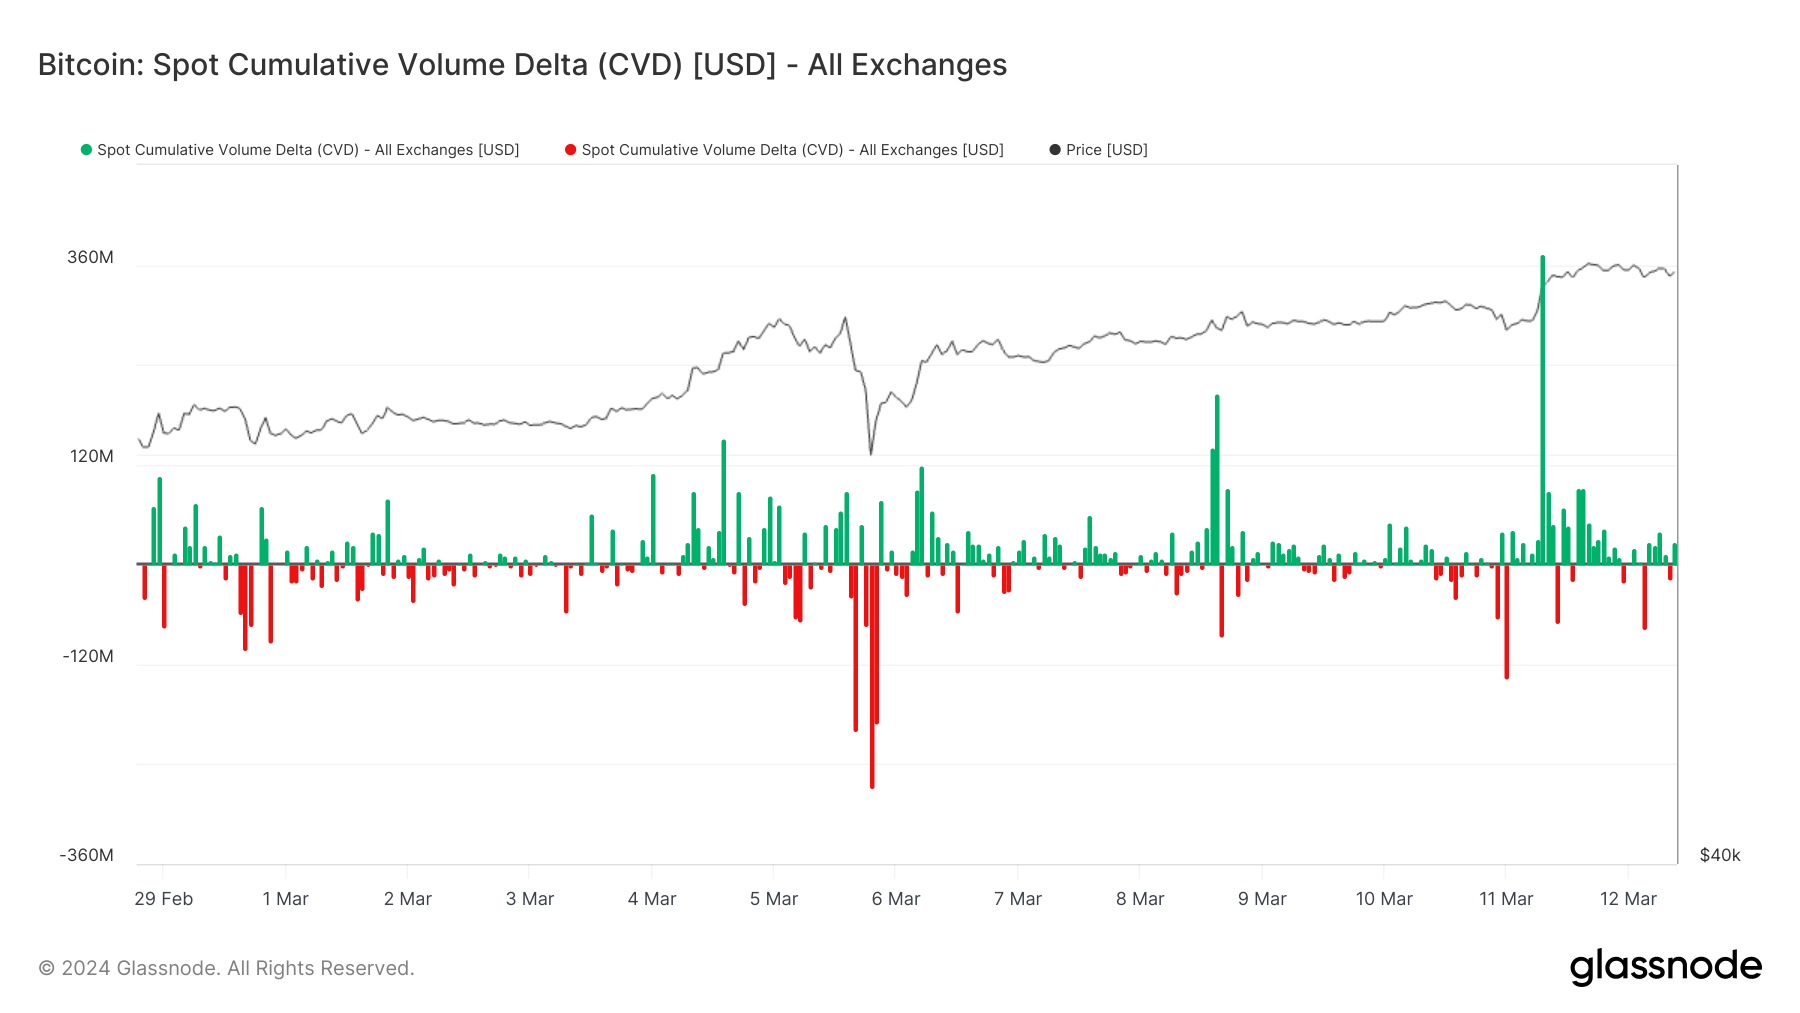
[Editorial Note: it is important to note that the CVD data may not consider all Bitcoin activity due to high OTC trading levels off-exchange. The correlation of $360 million leading to a $3,000 increase in Bitcoin price is only a part of the story. Creating ratios from this figure alone may create overly bullish sentiment. That said, this is a critical piece of the puzzle in determining purchasing multiples for Bitcoin.]
The March 11 spike comes on the heels of volatility in the CVD throughout the first months of 2024. The year started with the indicator in positive territory before plunging into negative figures in early January, suggesting a shift to selling pressure following the spot ETF launches in the US. However, the CVD rebounded sharply positive by late January and early February, indicating renewed buying activity.
Throughout February, the CVD fluctuated between positive and negative levels, reflecting a tug-of-war between buyers and sellers. A notable spike in late February coincided with Bitcoin’s price surging above $40,000. Entering March, the CVD experienced more ups and downs, including a steep drop in early March that aligned with a Bitcoin price dip.
The March 11 reading, however, stands out as a potentially significant bullish signal amid the recent volatility. As an on-chain metric that can reflect and potentially foreshadow considerable price moves, the Bitcoin Spot CVD provides valuable insights into Bitcoin’s supply and demand forces. The record-high March 11 figure suggests that aggressive buying pressure may be building, which could bode well for Bitcoin’s price in the near term.
The post $360 million sent Bitcoin from $68k to $71k amid highest spot buying of 2024 appeared first on CryptoSlate.


