Ethereum started a fresh increase and retested $1,700 against the US Dollar. ETH is showing positive signs and might rise further towards the $1,800 zone.
- Ethereum gained pace and was able to clear the $1,660 resistance zone.
- The price is now trading above $1,660 and the 100 hourly simple moving average.
- There was a break above a key bearish trend line with resistance near $1,640 on the hourly chart of ETH/USD (data feed via Kraken).
- The pair could rise further if there is a clear move above the $1,700 resistance.
Ethereum Price Reverses Losses
Ethereum price remained well bid above the $1,600 support, similar to bitcoin at $22,500. ETH formed a base above the $1,620 level and recently started a steady increase.
There was a clear move above the $1,650 and $1,660 resistance levels. Besides, there was a break above a key bearish trend line with resistance near $1,640 on the hourly chart of ETH/USD. The pair even retested the $1,700 resistance and formed a high at $1,698 before there was a minor decline.
Ether price is now trading above $1,660 and the 100 hourly simple moving average. It is trading near the 23.6% Fib retracement level of the upward move from the $1,624 swing low to $1,698 high.
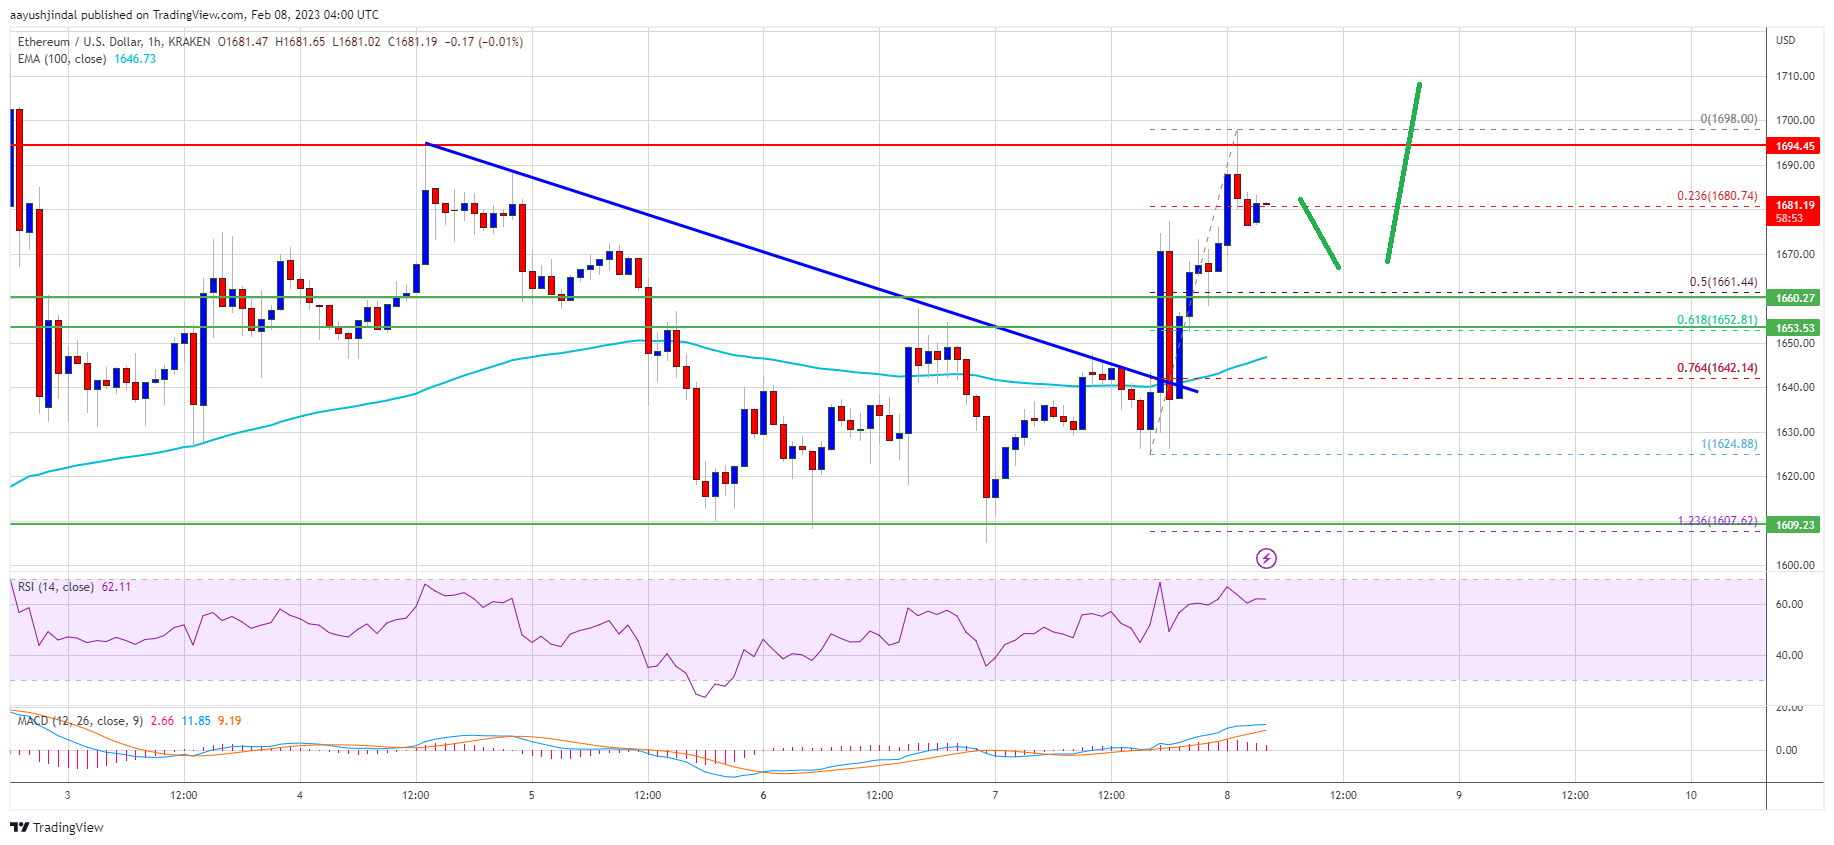
Source: ETHUSD on TradingView.com
An immediate resistance is near the $1,690 level. The next major resistance is near the $1,700 level. An upside break above the $1,700 resistance zone could spark a fresh increase. In the stated case, the price may perhaps rise towards the $1,750 resistance. Any more gains might send ether price towards the $1,820 resistance zone.
Dips Supported in ETH?
If ethereum fails to clear the $1,700 resistance, it could start another downside correction. An initial support on the downside is near the $1,660 level.
The next major support is near the $1,650 zone or the 61.8% Fib retracement level of the upward move from the $1,624 swing low to $1,698 high. If there is a break below $1,650, the price might accelerate lower towards the $1,620 support. Any more losses might call for a test of the $1,600 support zone.
Technical Indicators
Hourly MACD – The MACD for ETH/USD is now losing momentum in the bullish zone.
Hourly RSI – The RSI for ETH/USD is now above the 50 level.
Major Support Level – $1,650
Major Resistance Level – $1,700


