Aave has been securing steady gains over the past few days. Over the last 24 hours, the altcoin gained nearly 1.4%. Weekly gains have not been as high as Aave gained 3%
With Bitcoin swaying between two crucial levels of $28,000 and $28,500 in the past trading sessions, altcoins have remained undecided on their one-day charts. Although most altcoins have captured bullish momentum, they have been attempting to break past the immediate resistance level.
Buying strength increased slightly. Demand and accumulation also noted a positive change because of that. The technical outlook of Aave suggests that the bulls are trying to gain control over the price.
Aave’s market capitalization on the daily chart increased, indicating increased buying strength. Demand will rise significantly over the next trading sessions if buyers continue to exert strength. If BTC steadies over the $28,500 mark, other altcoins will slowly attempt to breach the overhead ceiling.
Aave Price Analysis: One-Day Chart
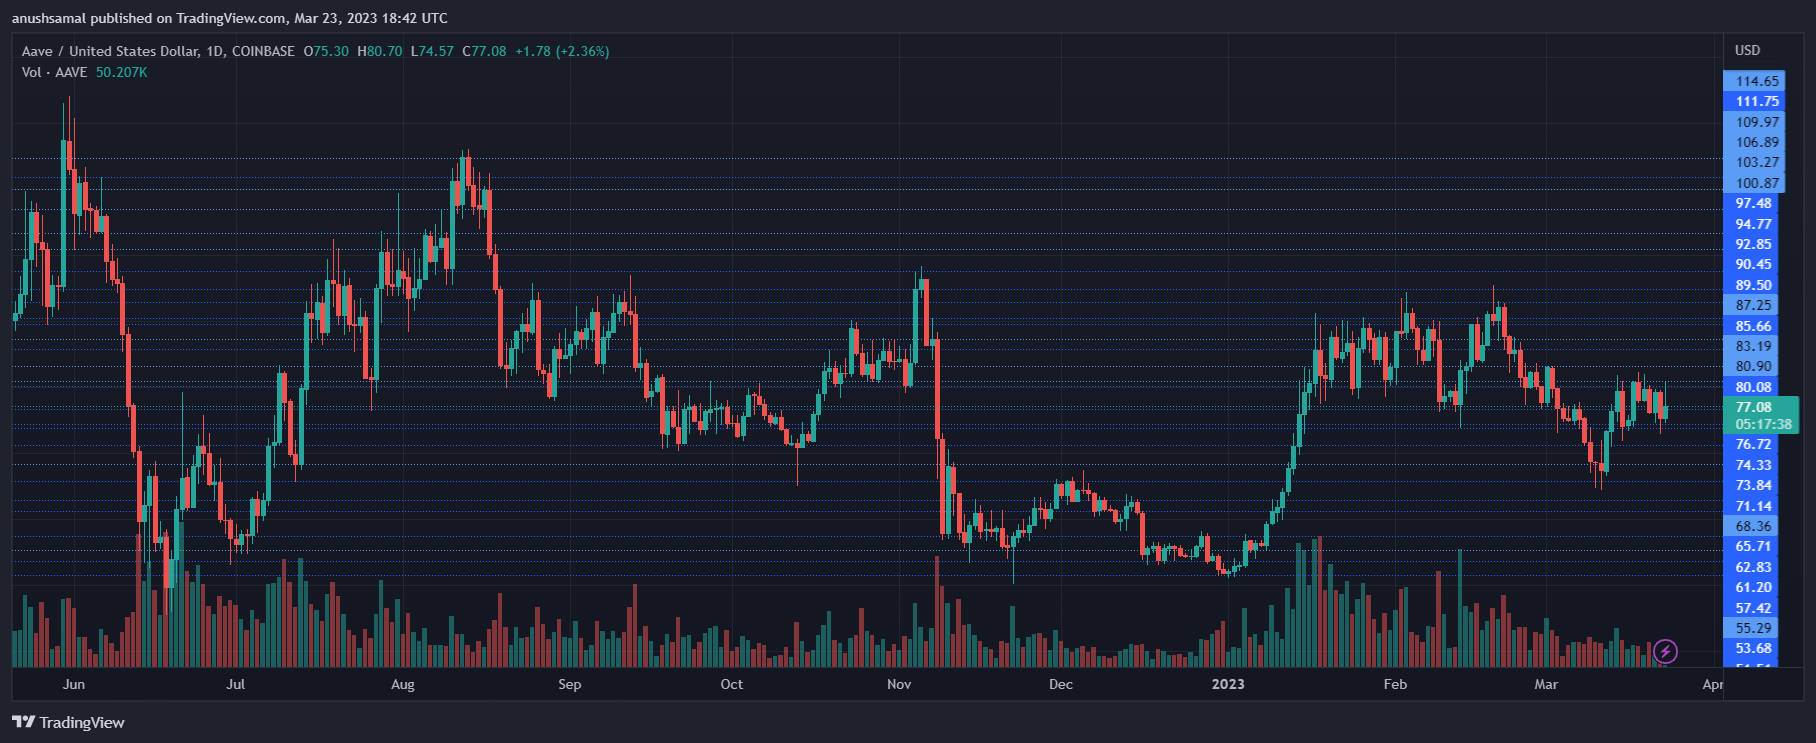
The altcoin was trading at $77 at the time of writing. As Aave broke past the $74 resistance line and flipped it into a support level, the coin started to surge. Overhead resistance stood at $78; breaching will help Aave reach the $80 mark.
If demand does not remain steady between the $76 and $78 price levels, Aave is expected to make another fall. Once Aave starts trading above $78 for many trading sessions, the altcoin will target $80. The amount of Aave traded in the previous session was green, indicating that the altcoin was in demand.
Technical Analysis
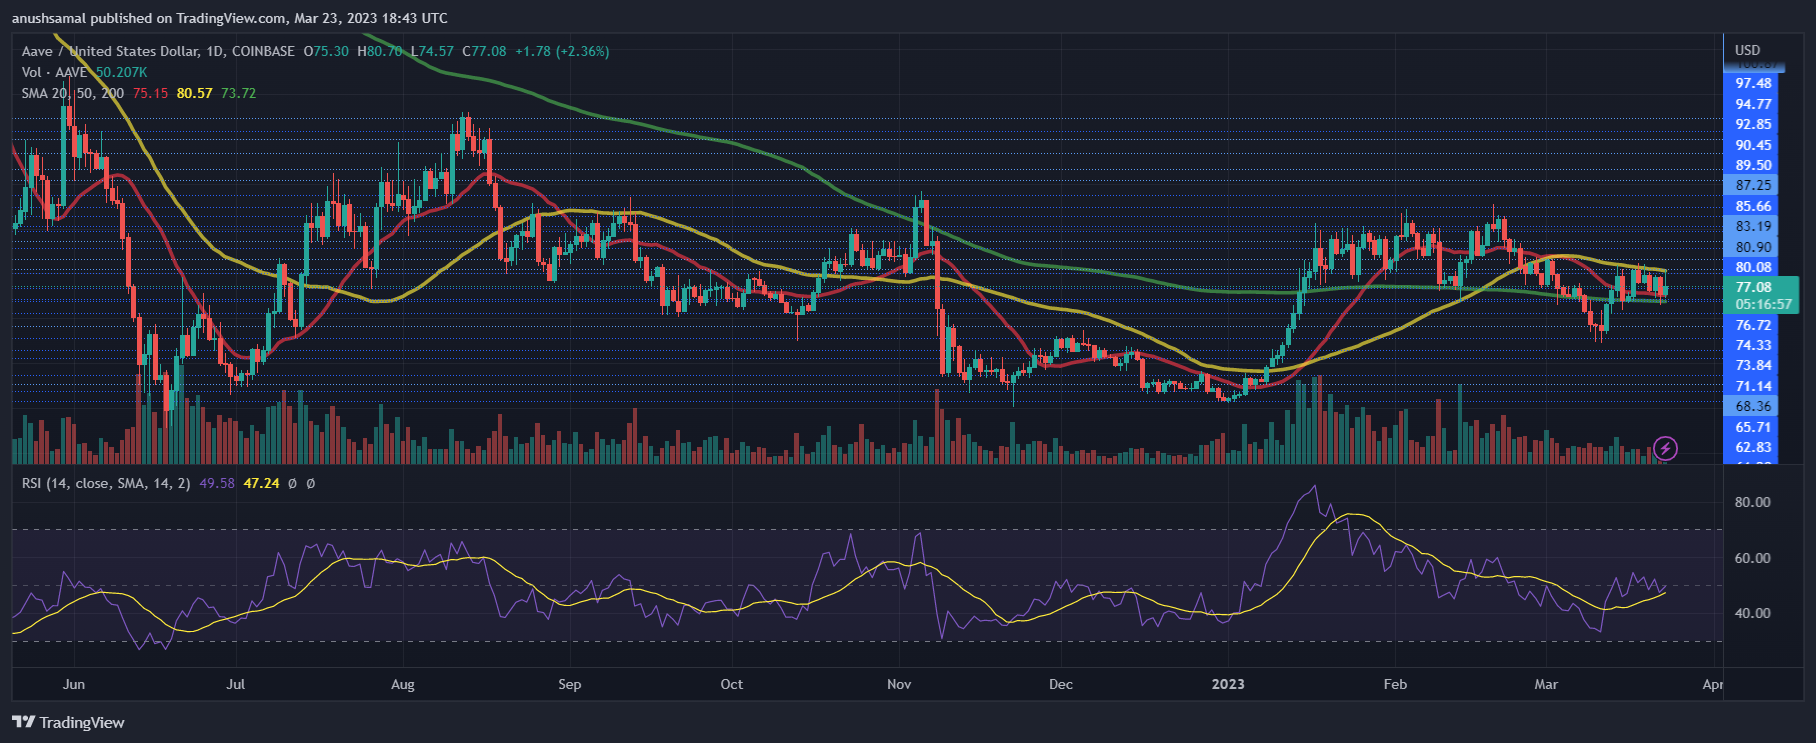
Since the second week of March, demand for the altcoin has started to increase. In the last week, demand finally moved closer to the positive zone. The Relative Strength Index noted an uptick and peaked above the half-line. This indicated that buyers were slowly increasing in number.
In accordance, Aave moved above the 20-Simple Moving Average (SMA) line as buyers were driving the price momentum in the market.
Another bullish signal that suggests the altcoin might breach the immediate ceiling was price trading above the 200-SMA line.
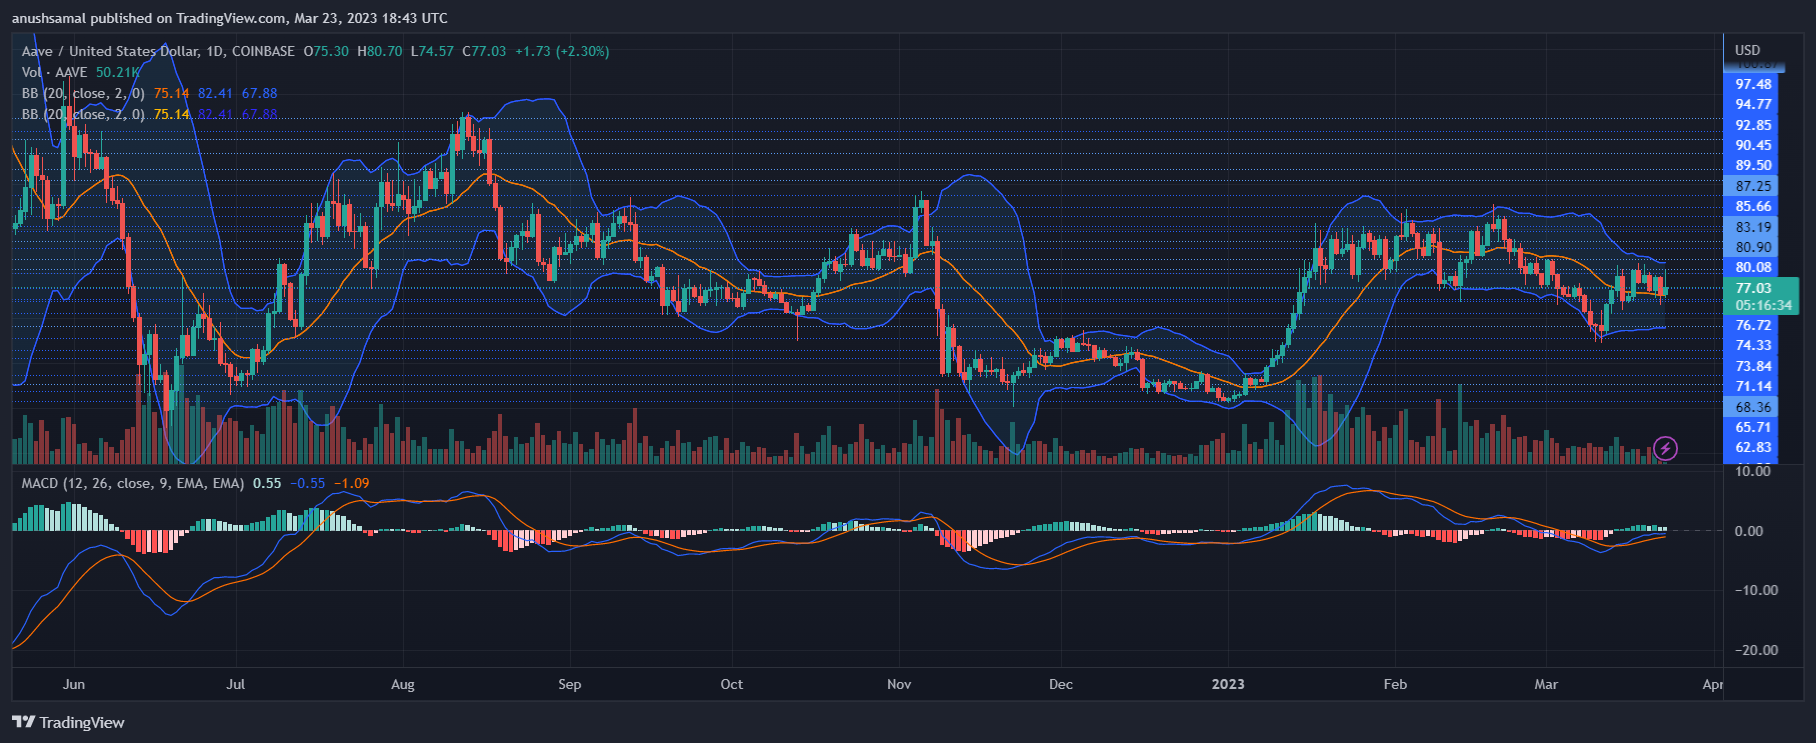
Other technical indicators have also depicted buyers gaining confidence in the asset. The Moving Average Convergence Divergence suggests price momentum and trend reversals.
The indicator formed green histograms tied to these buy signals. Bollinger Bands measure the price volatility and chance of price fluctuation in the market.
The bands remained parallel and stretched between $76 and $80, respectively, indicating that the $76 level was the lower trading frame, while Aave will face resistance at $80.


