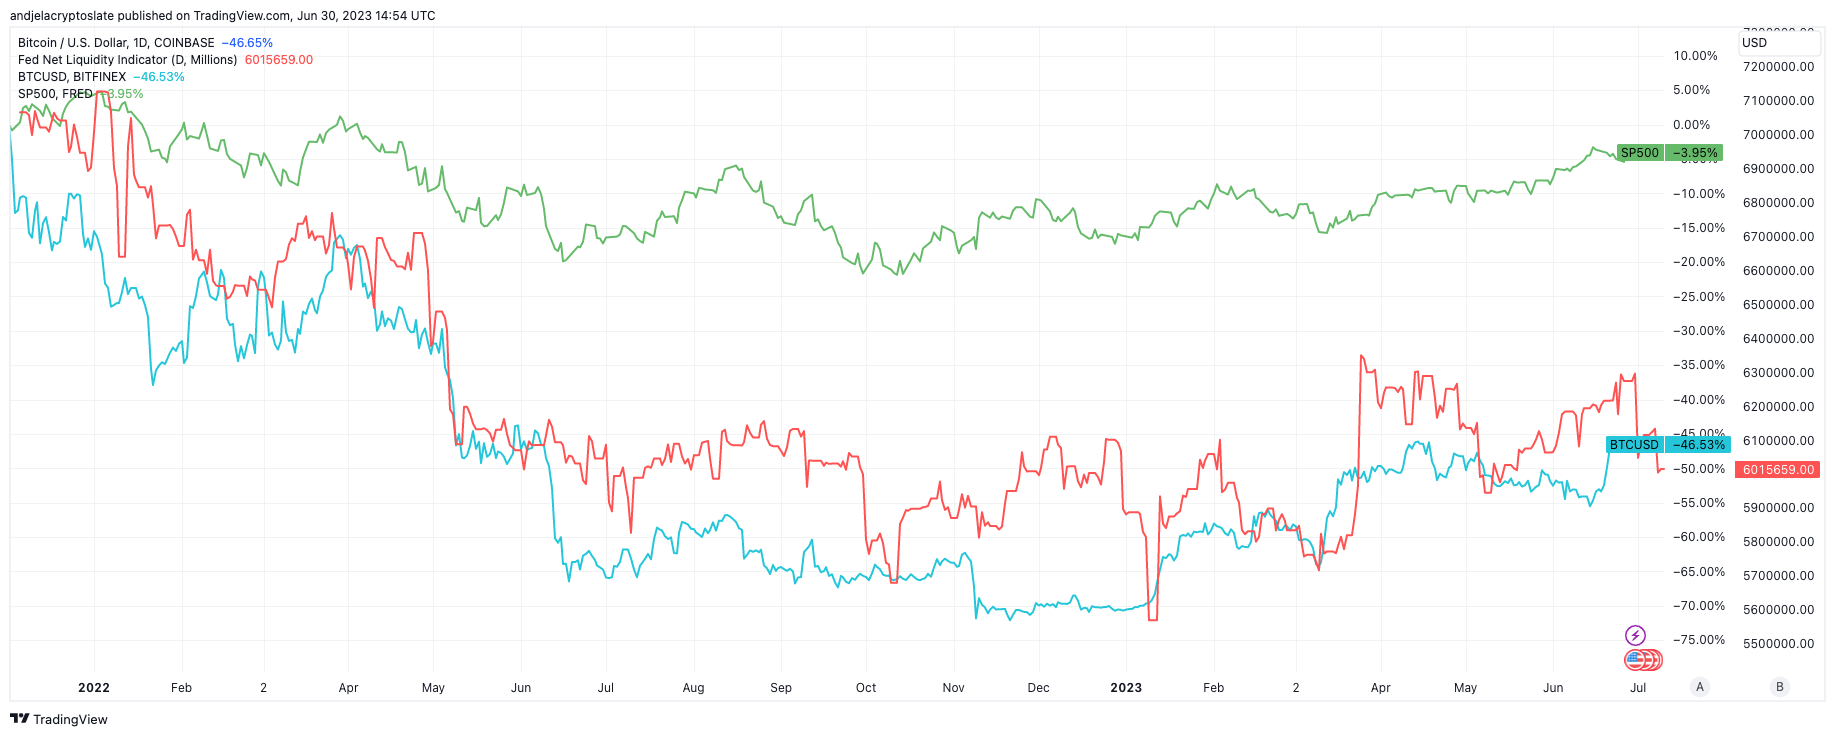
The Bitcoin and the S&P 500 Index have historically shown a near-perfect correlation with net liquidity, a key market metric often overlooked in market analysis.
However, as of June 2023, this correlation appears to be waning, potentially signaling a significant shift in market dynamics.
Net liquidity is calculated by subtracting ‘current liabilities’ from ‘liquid assets.’ In the context of the Federal Reserve, it involves deducting the amount in the Treasury General account and the value of overnight reverse repurchase agreements from the Fed’s balance sheet. This metric provides a snapshot of the Federal Reserve’s market intervention scale and has been a significant market driver, especially since the 2008 financial crisis.
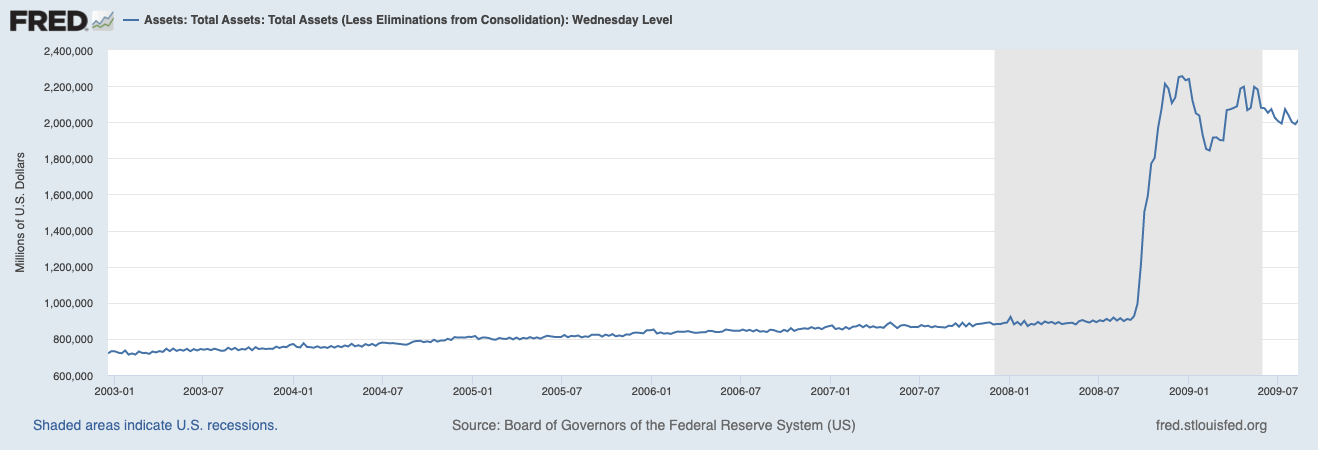
The Federal Reserve’s balance sheet size was a relatively unimportant indicator until the 2008 financial crisis. To combat the effects of the crisis, the Fed embarked on a historically unprecedented bout of quantitative easing, drastically increasing its balance sheet. This rapid increase in liabilities provided valuable insight into the scale of the Federal Reserve’s market intervention.
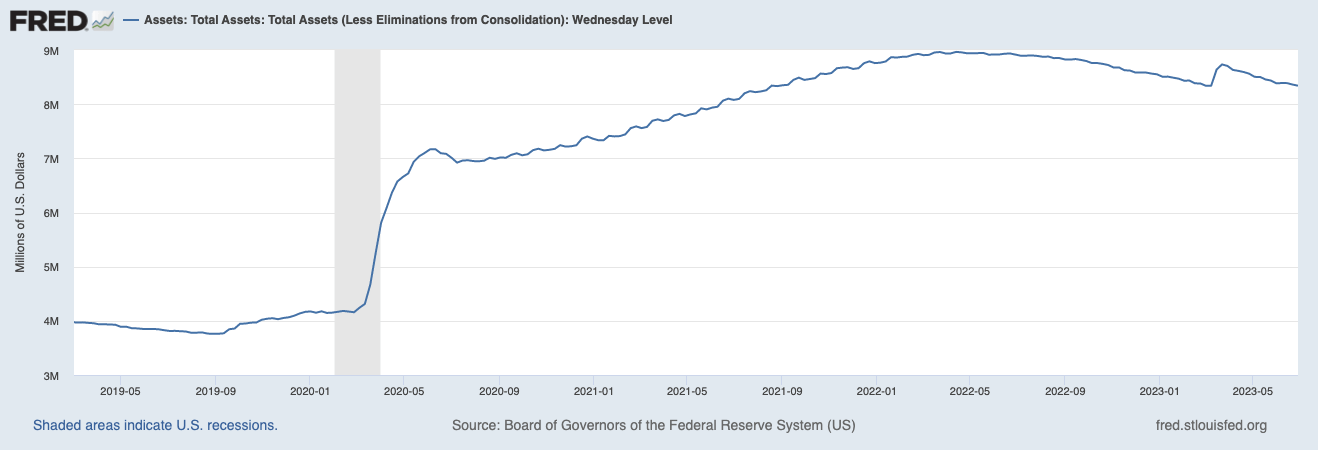
However, the correlation between net liquidity and asset prices changed in 2020. Despite the Federal Reserve nearly doubling the size of its balance sheet, adding $3.4 trillion between August 2019 and June 2020, the financial market in the U.S. quickly recovered from the historical crash in March 2020 and went on to post all-time highs. This led many analysts to hypothesize that the Fed lost its position as the U.S.’s primary market driver, replaced by the excess liquidity circulating in the economy.
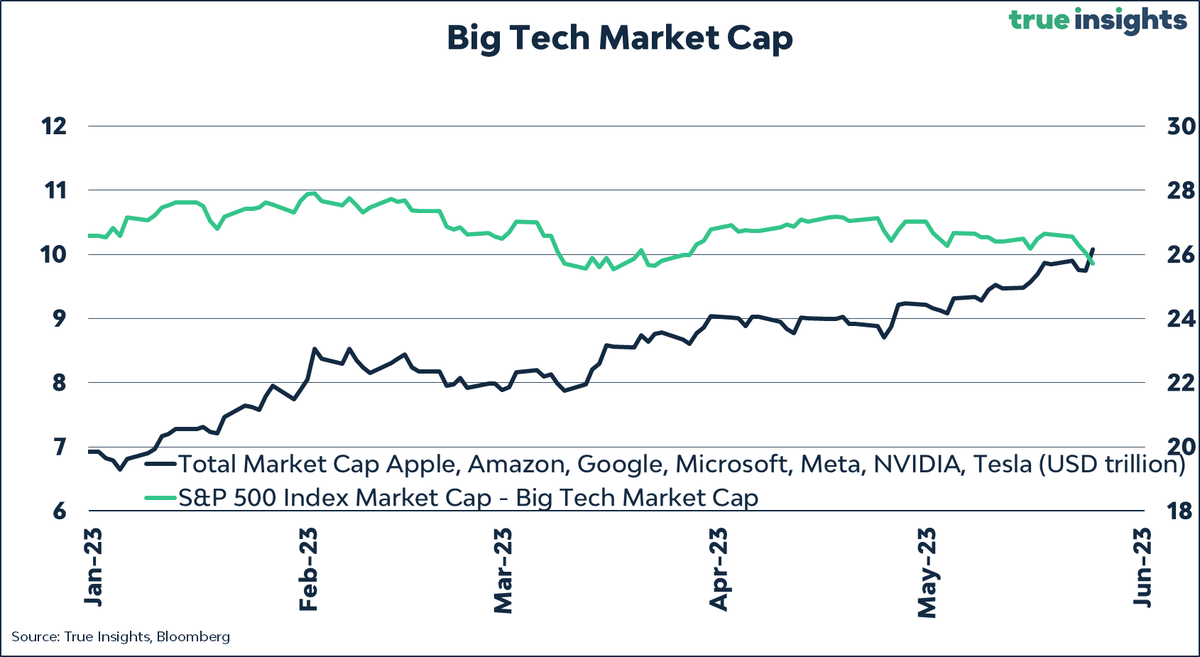
However, contrary to historical trends, net liquidity hasn’t been the primary market driver of the S&P 500 recently. A select group of technology and AI stocks predominantly propelled the index’s performance. These stocks defied the overall bearish market trend, suggesting a changing dynamic in the market.
Yet, a closer examination of the index paints a different picture. Previous CryptoSlate analysis found that excluding these outlier stocks from the index reveals a relatively stagnant performance. This suggests that the robust performance of the index may not be as broad-based as it initially appears but rather concentrated in a few high-performing sectors.
The decoupling of the S&P 500 from net liquidity is significant, as it has historically been a vital index driver.
When the S&P 500 decouples from net liquidity, it becomes less influenced by the broader economic factors that net liquidity represents, such as the Federal Reserve’s monetary policy and the economy’s overall health. Instead, the index’s performance is becoming more influenced by specific sectoral trends, such as AI and tech.
The decoupling of Bitcoin from net liquidity represents a different dynamic. Bitcoin operates in a different market environment than traditional financial assets like the S&P 500.
Bitcoin’s decoupling from net liquidity suggests that price movements are becoming more influenced by its market dynamics, such as intra-market supply and demand, rather than broader economic factors.
This could potentially lead to increased price stability for Bitcoin as its price becomes less influenced by external economic shocks. However, it could also increase the risk for Bitcoin investors as the cryptocurrency becomes more susceptible to market-specific risks.
As a result of this decoupling, Bitcoin could potentially see increased price stability since external economic shocks may influence it less. However, this also entails a potential increase in risk for Bitcoin investors as the cryptocurrency becomes more susceptible to market-specific risks.
The post Bitcoin and S&P 500 decouple from net liquidity appeared first on CryptoSlate.


