Cardano’s price started a fresh decline below $0.280. ADA is struggling and key indicators suggest high chances of more downsides below $0.252.
- ADA price is gaining bearish momentum below the $0.285 level against the US dollar.
- The price is trading above $0.280 and the 100 simple moving average (4 hours).
- There is a major bearish trend line forming with resistance near $0.274 on the 4-hour chart of the ADA/USD pair (data source from Kraken).
- The pair could start a recovery wave if there is a close above the $0.280 resistance.
Cardano’s ADA Price Faces Uphill Task
In the past few days, Cardano’s price saw a fresh decline from well above $0.288. The price traded below the $0.285 and $0.280 support levels to move into a bearish zone, similar to Bitcoin and Ethereum.
The price even declined below $0.265 and tested the $0.245 support. A low is formed near $0.2455 and the price is now consolidating losses. There was a minor increase above the 23.6% Fib retracement level of the downward move from the $0.3018 swing high to the $0.2455 low.
However, the bears are active near the $0.270 zone. ADA price is now trading below $0.280 and the 100 simple moving average (4 hours). There is also a major bearish trend line forming with resistance near $0.274 on the 4-hour chart of the ADA/USD pair.
On the upside, immediate resistance is near the $0.270 zone. The first major resistance is forming near the $0.274 zone and the trend line. It is close to the 50% Fib retracement level of the downward move from the $0.3018 swing high to the $0.2455 low.
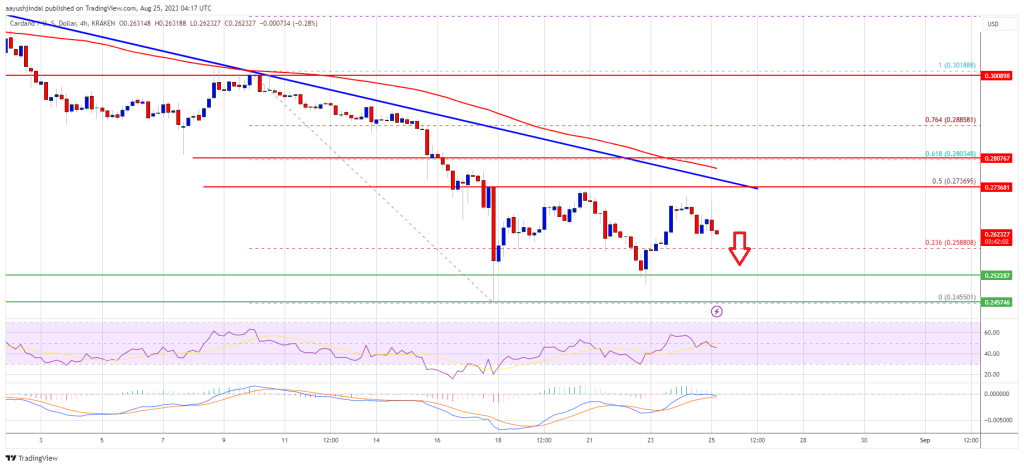
Source: ADAUSD on TradingView.com
The next key resistance might be $0.280. If there is a close above the $0.280 resistance, the price could start a decent increase. In the stated case, the price could rise toward the $0.300 resistance zone.
More Losses?
If Cardano’s price fails to climb above the $0.274 resistance level, it could start another decline. Immediate support on the downside is near the $0.252 level.
The next major support is near the $0.2455 level. A downside break below the $0.2455 level could open the doors for a sharp fresh decline toward $0.220. The next major support is near the $0.200 level.
Technical Indicators
4 hours MACD – The MACD for ADA/USD is gaining momentum in the bearish zone.
4 hours RSI (Relative Strength Index) – The RSI for ADA/USD is now below the 50 level.
Major Support Levels – $0.252, $0.2455, and $0.220.
Major Resistance Levels – $0.270, $0.274, and $0.280.


