Bitcoin price is back above $27,000 per coin after holding firm at $25,000 for a second time.
If price fails to move below support and makes another run for resistance, bulls might finally buck the downtrend with a powerful, measured move to $42,000.
Recapping 2023 Using Classical Technical Analysis Methods
2023 thus far has been the year that Bitcoin went mostly sideways. The year began with a strong surge from bear market lows, but failed to instill enough confidence for instant continuation. Even an inverse head and shoulders pattern has yet to produce the expected upside target.
Instead, BTCUSD has spent months and months going sideways, unable to break above $31,000 or below $25,000 per coin. With the top cryptocurrency finding support at $25,000 a second time, bulls might finally be emboldened.
Using classical charting methods such as a the inverse head and shoulders neckline support and a simple downtrend line, we can begin to understand the technical explanation for the pause around this zone.
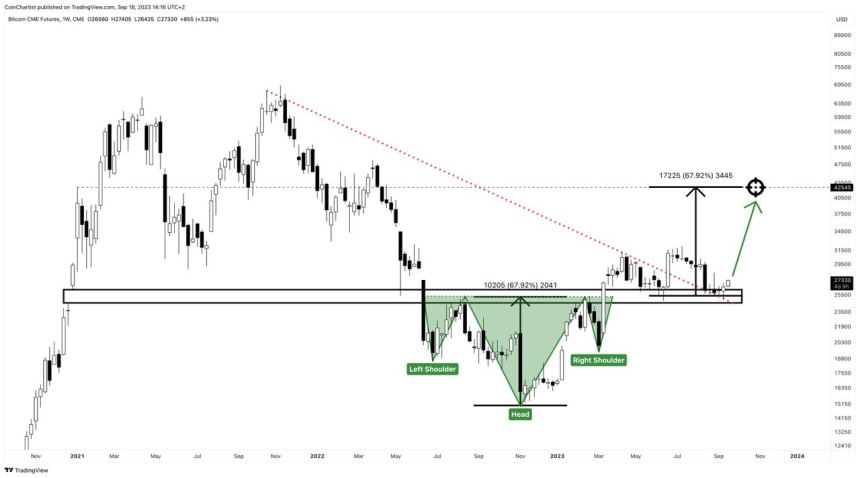
The Tale Of Two Retest And The $42,000 Target
It is common of an inverse head and shoulders pattern for price to throw back to former neckline resistance and retest it as support. This allows buyers to get in at lower levels, while those who bought earlier take profit.
After a retest, Bitcoin made a substantial move up breaking through a downtrend line drawn from all-time highs. However, the confidence was still not enough for proper follow through, so Bitcoin fell back to $25,000 to test the downtrend line it broke out from.
With the level tested now twice and proving to be seemingly unbreakable, bulls might finally have the confidence to meet the target of the inverse head and shoulders pattern. This target is located at $42,000 per BTC.
This chart originally appeared in Issue #21 of CoinChartist (VIP), where several other Bitcoin price charts demonstrate confluence with the target. Subscribe for free to view the rest of the Bitcoin charts.


