Bitcoin price found support near the $27,200 zone. BTC is now rising and might accelerate higher if it clears the $27,850 resistance zone.
- Bitcoin is attempting a fresh increase from the $27,200 support.
- The price is trading above $27,500 and the 100 hourly Simple moving average.
- There is a key rising channel forming with resistance near $27,850 on the hourly chart of the BTC/USD pair (data feed from Kraken).
- The pair could rise further and revisit $28,500 if it clears the $27,850 resistance zone.
Bitcoin Price Holds Support
Bitcoin price found support near the $27,200 level after a downside correction. BTC remained well-bid and recently started a fresh increase above $27,400.
There was a move above the 23.6% Fib retracement level of the downside correction from the $28,565 swing high to the $27,188 low. Besides, the price surpassed the $27,650 resistance and the 100 hourly Simple moving average.
However, the bears were active near the $27,850 resistance. BTC struggled near the 50% Fib retracement level of the downside correction from the $28,565 swing high to the $27,188 low.
Bitcoin is now trading above $27,500 and the 100 hourly Simple moving average. Immediate resistance on the upside is near the $27,850 level. There is also a key rising channel forming with resistance near $27,850 on the hourly chart of the BTC/USD pair.
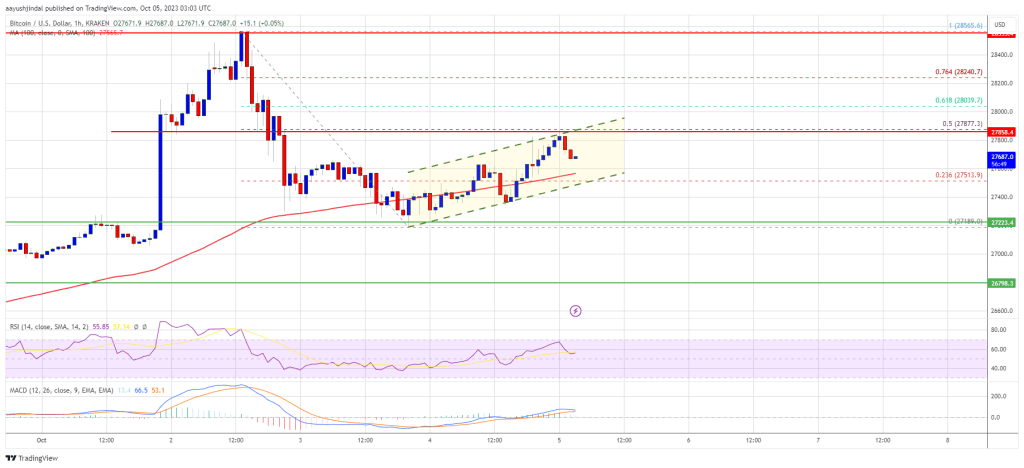
Source: BTCUSD on TradingView.com
The next key resistance could be near the $28,000 level. A close above the $28,000 resistance could start another increase. In the stated case, the price could climb toward the $28,500 resistance. Any more gains might call for a move toward the $29,200 level.
Another Decline In BTC?
If Bitcoin fails to continue higher above the $27,850 resistance, there could be another decline. Immediate support on the downside is near the $27,500 level and the 100 hourly Simple moving average.
The next major support is near the $27,400 level. The main support is now near $27,200. A downside break and close below the $27,200 level might send the price toward $26,800 in the near term. The next support sits at $26,200.
Technical indicators:
Hourly MACD – The MACD is now losing pace in the bullish zone.
Hourly RSI (Relative Strength Index) – The RSI for BTC/USD is now above the 50 level.
Major Support Levels – $27,500, followed by $27,200.
Major Resistance Levels – $27,850, $28,000, and $28,500.


