Bitcoin price is still struggling below the $65,000 resistance zone. BTC must stay above the $60,000 support zone to avoid a major decline.
- Bitcoin is still struggling to gain pace for a move above the $65,000 resistance zone.
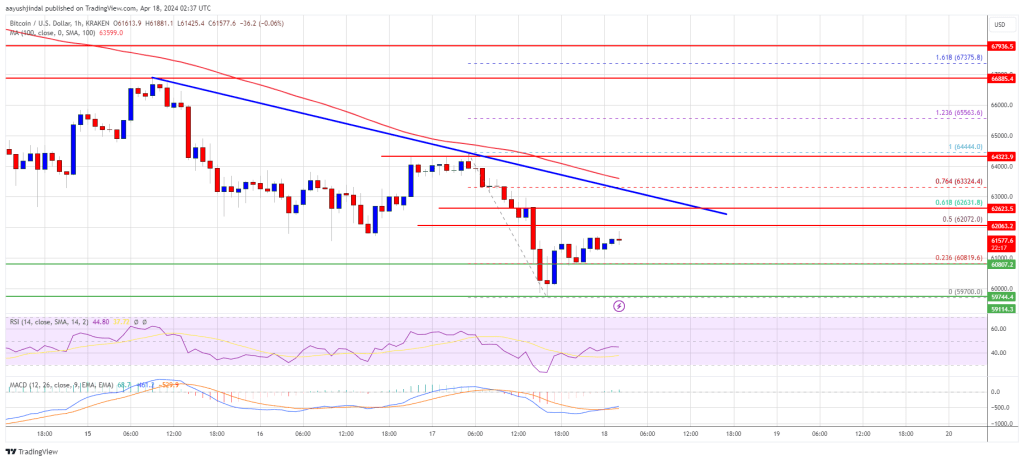
- The price is trading below $63,000 and the 100 hourly Simple moving average.
- There is a key bearish trend line forming with resistance at $62,650 on the hourly chart of the BTC/USD pair (data feed from Kraken).
- The pair could gain bullish momentum if it clears the $63,000 resistance zone.
Bitcoin Price Remains At Risk
Bitcoin price failed to clear the $64,500 resistance zone. BTC formed a short-term top at $64,450 and started another decline. There was a move below the $63,000 and $62,000 levels.
The price even spiked below the $60,000 level. A low was formed near $59,700 and the price is now attempting a fresh recovery wave. The price climbed above the 23.6% Fib retracement level of the recent decline from the $64,444 swing high to the $59,700 low.
Bitcoin price is trading below $63,000 and the 100 hourly Simple moving average. Immediate resistance is near the $62,000 level. It is close to the 50% Fib retracement level of the recent decline from the $64,444 swing high to the $59,700 low.
The first major resistance could be $62,650 and the trend line. The next resistance now sits at $63,000. If there is a clear move above the $63,000 resistance zone, the price could continue to move up. In the stated case, the price could rise toward $64,500.
Source: BTCUSD on TradingView.com
The next major resistance is near the $65,000 zone. Any more gains might send Bitcoin toward the $66,500 resistance zone in the near term.
More Losses In BTC?
If Bitcoin fails to rise above the $63,000 resistance zone, it could start another decline. Immediate support on the downside is near the $60,800 level.
The first major support is $60,000. If there is a close below $60,000, the price could start to drop toward the $59,200 level. Any more losses might send the price toward the $58,500 support zone in the near term.
Technical indicators:
Hourly MACD – The MACD is now losing pace in the bearish zone.
Hourly RSI (Relative Strength Index) – The RSI for BTC/USD is now below the 50 level.
Major Support Levels – $60,800, followed by $60,000.
Major Resistance Levels – $62,650, $63,000, and $64,500.


