Stablecoins are the foundation of the DeFi ecosystem. Given the relatively high barriers to entry for fiat currencies and the operational complexities associated with bridging Bitcoin into DeFi protocols, they are the crucial conduits through which liquidity flows and fuels the sector.
Tracking the distribution of stablecoins and their market caps across different blockchain platforms provides valuable insights into the liquidity distribution, risk exposure, and overall health of the DeFi ecosystem. As stablecoins represent a significant portion of the liquid assets within DeFi, their distribution can indicate both the vibrancy of economic activity and the level of user trust across different platforms.
Increases in stablecoin market cap generally suggest growing confidence in DeFi as a safe and profitable arena for investment, indicating that more capital is flowing into the market, ready to be deployed across various protocols. Conversely, decreases might signal withdrawals or a potential shift in investor sentiment, possibly due to concerns over security, profitability, or regulatory changes affecting the landscape.
Moreover, the relationship between stablecoins issued on a particular chain versus those bridged to it is a subtle indicator of the chain’s role within the broader market. A blockchain with a higher volume of issued stablecoins than those bridged outward often serves as a primary hub for stablecoin creation and initial distribution, reflecting a robust, internally driven DeFi environment. On the other hand, a chain that has more bridged stablecoins than issued might predominantly function as a conduit or intermediary between different networks, facilitating cross-chain liquidity and enabling broader interconnectivity within DeFi.
This helps us see how interdependent the nature of chains within the DeFi ecosystem is and shows the importance of understanding stablecoin flows for predicting market trends and potential bottlenecks in liquidity distribution.
As of April 18, the total stablecoin market cap is $154.752 billion. Diving deeper into the market cap reveals significant variances in their distribution and utilization across various blockchain platforms.
Data from DeFi Llama shows Ethereum and Tron are the dominant players in the DeFi space. Ethereum holds the largest share of stablecoins, with $80.479 billion, accounting for 52.02% of the total market cap. It shows Ethereum’s dominant role in the DeFi ecosystem and cements its status as the primary platform for stablecoin issuance. The data shows that while a substantial amount of stablecoin value is issued on Ethereum, only a minor portion ($16.21 million) is bridged to other networks, suggesting that it serves more as a source than a stablecoin economy conduit.
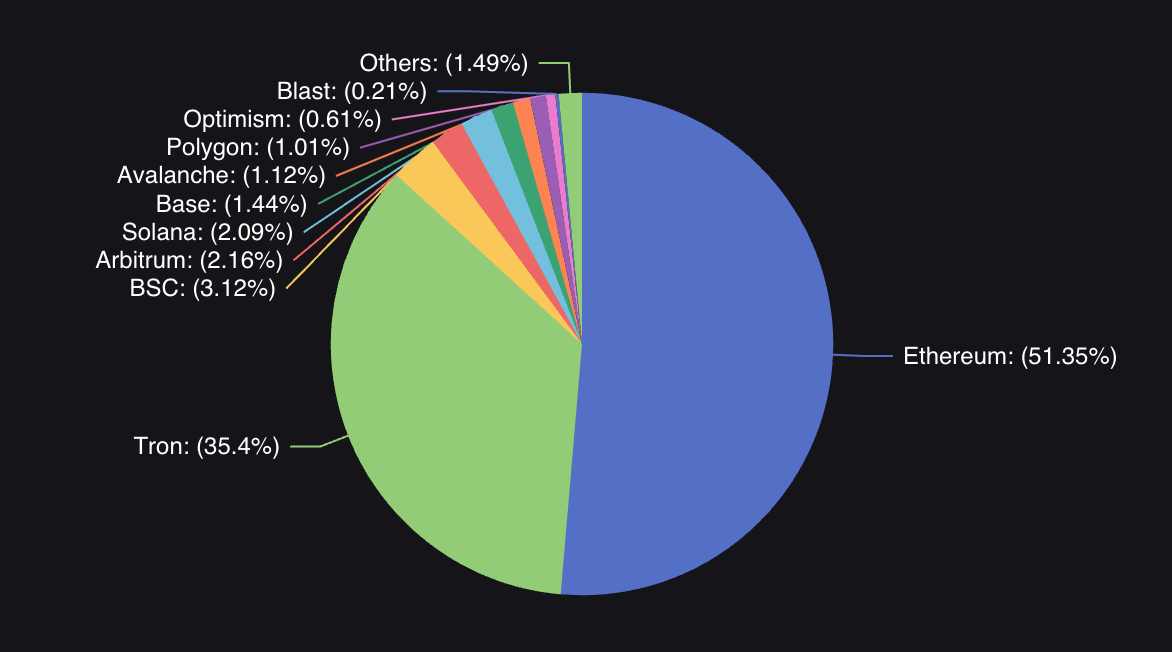
Tron holds $55.538 billion or 35.9% of the total market, with a remarkable 98.21% of this being Tether (USD). This concentration signals a specific preference or functionality that users find appealing in Tron’s ecosystem, perhaps due to its operational efficiencies or targeted market strategies that favor USDT. Unlike Ethereum, almost all the stablecoin value issued on Tron remains within the ecosystem, showing its closed nature.
Other chains like BSC, Arbitrum, Solana, Avalanche, and Polygon contribute to the stablecoin market but to a lesser extent, ranging from 1.02% to 3.16% of the total market cap. The differences in issuance and bridging activities across these chains reveal their varied roles. For instance, BSC and Arbitrum, despite their smaller issuance amounts, see more substantial bridging activities. This pattern suggests that they function as intermediary networks, facilitating the movement of stablecoins rather than being primary issuance hubs.
| Rank | Name | 7d change | Stables Mcap | Dominant Stablecoin | Total Mcap Issued On | Total Mcap Bridged To | Stables Mcap/TVL |
|---|---|---|---|---|---|---|---|
| 1 | Ethereum | +2.06% | $80.479b | USDT: 54.98% | $88.842b | $16.21m | 0.72 |
| 2 | Tron | +1.23% | $55.538b | USDT: 98.21% | $57.709b | $0 | 6.9 |
| 3 | BSC | +2.04% | $4.898b | USDT: 75.12% | $626.81m | $4.279b | 0.72 |
| 4 | Arbitrum | -0.11% | $3.382b | USDT: 65.28% | $702.51m | $2.683b | 0.85 |
| 5 | Solana | +8.24% | $3.271b | USDC: 75.69% | $3.269b | $7.86m | 0.52 |
| 6 | Avalanche | +2.92% | $1.76b | USDT: 66.37% | $1.649b | $111.26m | 1.37 |
| 7 | Polygon | +3.27% | $1.585b | USDT: 52.96% | $227.65m | $1.359b | 1.6 |
The stablecoin market cap to total value locked (TVL) ratio provides insights into how much of a blockchain’s DeFi activity is driven by stablecoins. Chains like Tron, with a high ratio of 6.9, and Polygon, at 1.6, indicate a significant reliance on stablecoins within their DeFi ecosystems, suggesting that stablecoin-based financial products are crucial to their market. Conversely, lower ratios in Solana (0.52) and Ethereum (0.72) point to more diversified ecosystems where other types of assets also hold substantial importance.
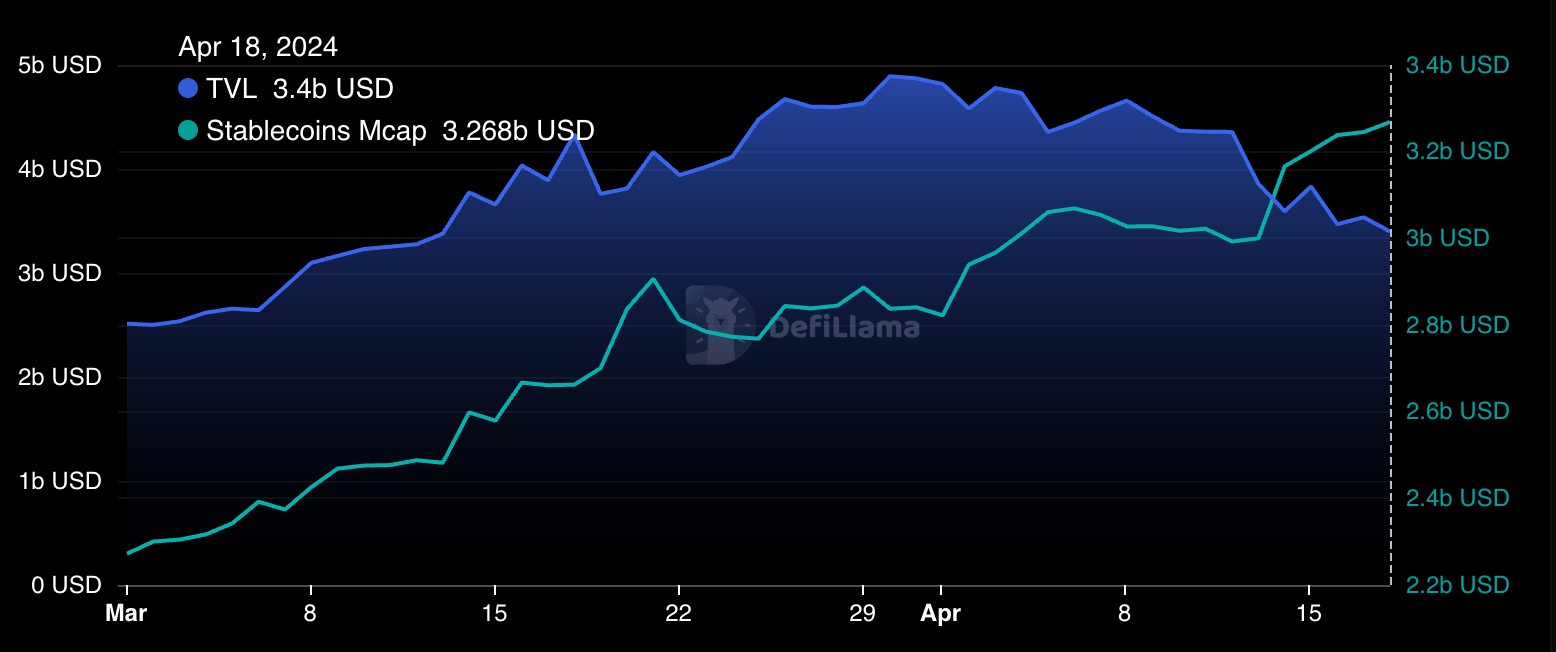
Solana has a unique profile in this broader context. Between April 13 and April 17, Solana’s stablecoin market cap increased from $3 billion to $3.271 billion. During the same period, the total value locked slightly declined from $3.858 billion to $3.438 billion, showing an increasing concentration of stablecoins relative to other assets.
Within Solana, the distribution is notably skewed towards USD Coin (USDC), which saw a significant increase of 30.11% over the past month, reaching $2.474 billion. This growth contrasts with Tether (USDT), which holds a smaller share at $774.74 million and witnessed a slight decrease. The presence of smaller players like UXD Stablecoin, although minor in comparison, indicates emerging opportunities and niche applications within Solana’s DeFi landscape.
| Name | 1m % Change | Market Cap |
|---|---|---|
| USD Coin (USDC) | +30.19 | $2.475b |
| Tether (USDT) | -0.68% | $774.3m |
| UXD Stablecoin | +23.90% | $9.23m |
| Parrot USD (PAI) | -1.70% | $5.15m |
| USDH (USDH) | -15.73% | $2.68m |
Table showing the distribution of stablecoins on Solana and their 30-day change in market cap on April 18, 2024 (Source: DeFi Llama)
The difference in stablecoin distribution and utilization across chains shows a complex market where each chain supports stablecoins differently and reflects the broader strategic and operational priorities within the DeFi ecosystem. With its increasing reliance on USDC, Solana has a distinctive approach to stablecoin integration, which could affect its positioning and strategic development in DeFi.
The post Stablecoin distribution reveals liquidity patterns in DeFi appeared first on CryptoSlate.


