Ethereum price started a downside correction from the $3,150 zone. ETH is holding gains and might start another increase from the $3,000 support.
- Ethereum started a downside correction after the bears defended $3,150.
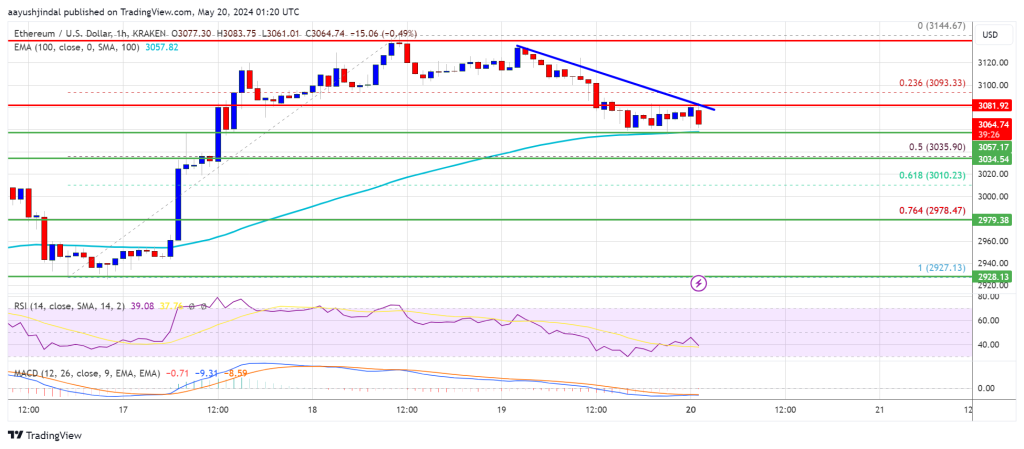
- The price is trading above $3,000 and the 100-hourly Simple Moving Average.
- There is a connecting bearish trend line forming with resistance at $3,080 on the hourly chart of ETH/USD (data feed via Kraken).
- The pair could start a fresh increase unless there is a close below the $3,000 support.
Ethereum Price Holds Ground
Ethereum price gained pace after it settled above the $3,000 level, like Bitcoin. ETH even cleared the $3,050 level before the bears appeared near $3,150. A new weekly high was formed at $3,144 and the price recently started a downside correction.
There was a move below the $3,100 level. Ether dipped below the 23.6% Fib retracement level of the upward move from the $2,927 swing low to the $3,144 high.
Ethereum is now trading above $3,000 and the 100-hourly Simple Moving Average. The bulls are active near the $3,065 support and they are protecting the 50% Fib retracement level of the upward move from the $2,927 swing low to the $3,144 high.
Immediate resistance is near the $3,080 level. There is also a connecting bearish trend line forming with resistance at $3,080 on the hourly chart of ETH/USD. The first major resistance is near the $3,150 level. An upside break above the $3,150 resistance might send the price higher.
The next key resistance sits at $3,200, above which the price might gain traction and rise toward the $3,250 level. If there is a clear move above the $3,250 level, the price might rise and test the $3,320 resistance. Any more gains could send Ether toward the $3,500 resistance zone.
More Losses In ETH?
If Ethereum fails to clear the $3,080 resistance and the trend line, it could continue to move down. Initial support on the downside is near the $3,065 level.
The next major support is near the $3,000 zone. A clear move below the $3,000 support might push the price toward $2,980. Any more losses might send the price toward the $2,860 level in the near term.
Technical Indicators
Hourly MACD – The MACD for ETH/USD is losing momentum in the bullish zone.
Hourly RSI – The RSI for ETH/USD is now below the 50 level.
Major Support Level – $3,000
Major Resistance Level – $3,080


