XRP price avoided a major downside break as ETH’s surges. The price is back above $0.5220 and eyeing a key upside break in the near term.
- XRP started a decent increase above the $0.5150 resistance zone.
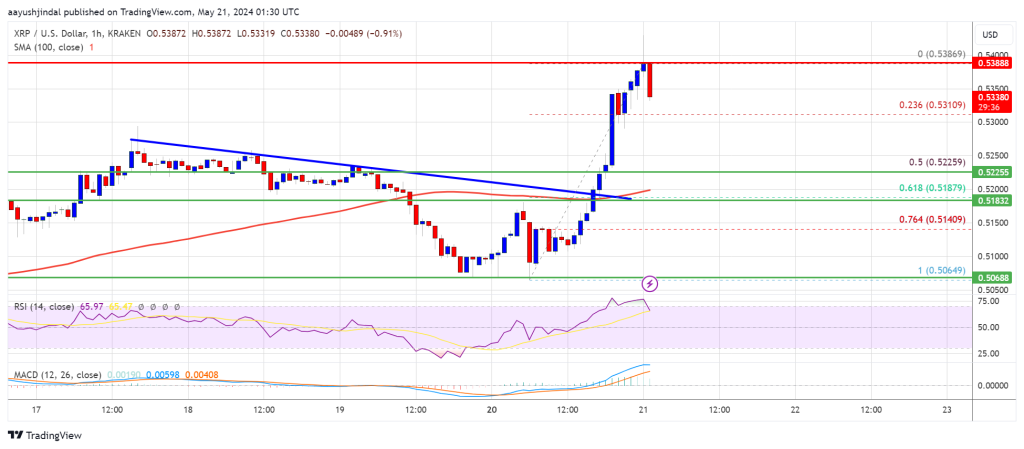
- The price is now trading above $0.5250 and the 100-hourly Simple Moving Average.
- There was a break above a key bearish trend line with resistance at $0.520 on the hourly chart of the XRP/USD pair (data source from Kraken).
- The pair could correct gains, but the bulls might remain active near the $0.5180 zone.
XRP Price Recovers
After a drop toward the $0.5065 support, XRP price started a recovery wave. Recently, Ethereum rallied over 20% and Bitcoin climbed above $70,000. It sparked decent bullish moves in XRP.
The price climbed above the $0.5150 and $0.520 resistance level. There was a break above a key bearish trend line with resistance at $0.520 on the hourly chart of the XRP/USD pair. The pair even broke the $0.5320 resistance and traded as high as $0.5386.
The price is now correcting gains and might test the 23.6% Fib retracement level of the upward wave from the $0.5064 swing low to the $0.5386 high.
It is now trading above $0.5250 and the 100-hourly Simple Moving Average. Immediate resistance is near the $0.5380 level. The first key resistance is near $0.5420. A close above the $0.5420 resistance zone could send the price higher. The next key resistance is near $0.5550.
If the bulls push the price above the $0.5550 resistance level, there could be a fresh move toward the $0.5650 resistance. Any more gains might send the price toward the $0.5720 resistance.
Another Decline?
If XRP fails to clear the $0.5380 resistance zone, it could start a downside correction. Initial support on the downside is near the $0.5310 level. The next major support is at $0.5250.
The main support is now near $0.5220 or the 50% Fib retracement level of the upward wave from the $0.5064 swing low to the $0.5386 high. If there is a downside break and a close below the $0.5220 level, the price might accelerate lower. In the stated case, the price could drop and test the $0.5065 support in the near term.
Technical Indicators
Hourly MACD – The MACD for XRP/USD is now losing pace in the bullish zone.
Hourly RSI (Relative Strength Index) – The RSI for XRP/USD is now above the 50 level.
Major Support Levels – $0.5310 and $0.5220.
Major Resistance Levels – $0.5380 and $0.5420.


