Bitcoin price started a downside correction from the $72,000 zone. BTC is now consolidating near $70,000 and might eye another increase in the near term.
- Bitcoin struggled above the $71,800 resistance zone.
- The price is trading above $69,000 and the 100 hourly Simple moving average.
- There is a key bullish trend line forming with support at $69,200 on the hourly chart of the BTC/USD pair (data feed from Kraken).
- The pair could start another increase unless there is a move below $68,800.
Bitcoin Price Corrects Gains
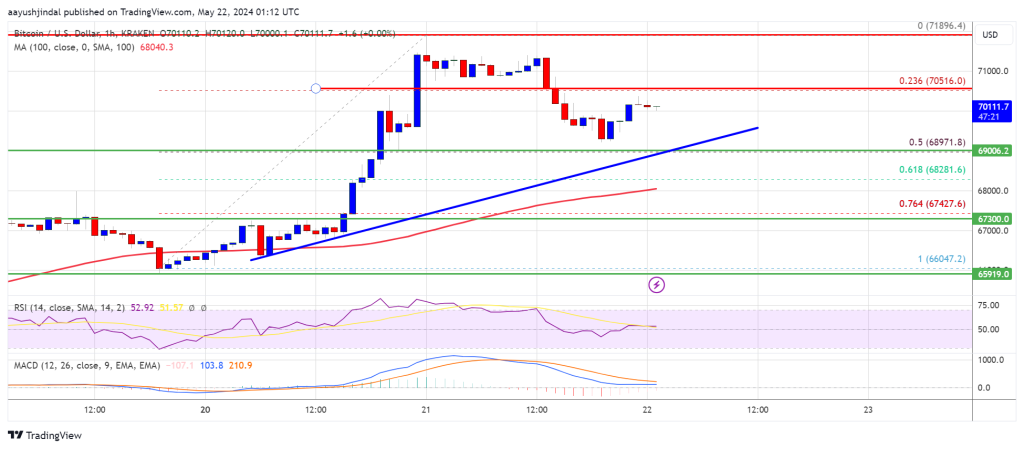
Bitcoin price gained pace for a move above the $70,000 level. BTC even spiked above $71,200 before the bears appeared near $72,000. A new weekly high was formed at $71,896 and the price recently started a downside correction.
The price declined below the $71,000 level and the 23.6% Fib retracement level of the upward wave from the $66,047 swing low to the $71,896 high.
However, the bulls are active above the $68,800 support zone. Bitcoin also trades above $69,000 and the 100 hourly Simple moving average. Besides, there is a key bullish trend line forming with support at $69,200 on the hourly chart of the BTC/USD pair.
The price is now facing resistance near the $70,500 level. The first major resistance could be $71,200. The next key resistance could be $71,850. A clear move above the $71,850 resistance might send the price higher. In the stated case, the price could rise and test the $72,500 resistance.
If the bulls push the price further higher, there could be a move toward the $73,200 resistance zone. Any more gains might send BTC toward the $74,500 resistance.
Are Dips Supported In BTC?
If Bitcoin fails to climb above the $71,200 resistance zone, it could continue to move down. Immediate support on the downside is near the $69,200 level and the trend line.
The first major support is $69,000. The main support is now forming near $68,800 or the 50% Fib retracement level of the upward wave from the $66,047 swing low to the $71,896 high. Any more losses might send the price toward the $67,300 support zone in the near term.
Technical indicators:
Hourly MACD – The MACD is now losing pace in the bullish zone.
Hourly RSI (Relative Strength Index) – The RSI for BTC/USD is now above the 50 level.
Major Support Levels – $69,200, followed by $68,800.
Major Resistance Levels – $70,500, $71,200, and $71,800.


