BNB price started a fresh increase and cleared the $500 pivot zone. The price is now consolidating gains and might aim for more gains above $525.
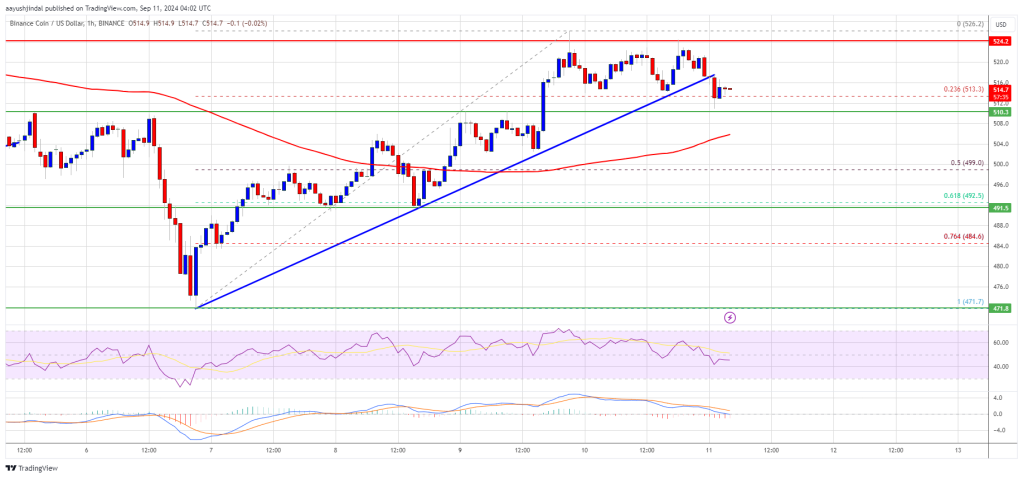
- BNB price started a fresh increase above the $500 resistance zone.
- The price is now trading below $510 and the 100-hourly simple moving average.
- There was a break below a key bullish trend line with support at $517 on the hourly chart of the BNB/USD pair (data source from Binance).
- The pair must stay above the $500 pivot level to start another increase in the near term.
BNB Price Settles Above $500
After forming a base above the $470 level, BNB price started a fresh increase like Ethereum and Bitcoin. The price was able to climb above the $488 and $500 resistance levels.
It even cleared the $515 level and tested $525. A high was formed at $526 and the price started a downside correction. There was a move below the $520 level. The price slipped just below the 23.6% Fib retracement level of the upward move from the $471 swing low to the $526 high.
Besides, there was a break below a key bullish trend line with support at $517 on the hourly chart of the BNB/USD pair. The pair is now trading above $510 and the 100-hourly simple moving average.
If there is a fresh increase, the price could face resistance near the $518 level. The next resistance sits near the $525 level. A clear move above the $525 zone could send the price higher. In the stated case, BNB price could test $535.
A close above the $535 resistance might set the pace for a larger move toward the $550 resistance. Any more gains might call for a test of the $562 level in the near term.
Another Decline?
If BNB fails to clear the $525 resistance, it could start another decline. Initial support on the downside is near the $510 level. The next major support is near the $500 level.
The main support sits at $492. If there is a downside break below the $492 support, the price could drop toward the $470 support. Any more losses could initiate a larger decline toward the $450 level.
Technical Indicators
Hourly MACD – The MACD for BNB/USD is losing pace in the bullish zone.
Hourly RSI (Relative Strength Index) – The RSI for BNB/USD is currently above the 50 level.
Major Support Levels – $510 and $500.
Major Resistance Levels – $518 and $525.


