An analyst has pointed out a historical Dogecoin pattern that could suggest DOGE might see a bull run to as high as $23 this time around.
Dogecoin Could Be About To Go Parabolic According To This Pattern
In a new post on X, analyst Ali Martinez has discussed about where Dogecoin could be going next based on the pattern that has been observed during previous bull markets.
Below is the chart shared by the analyst, which shows how DOGE has recently once again been showing a familiar trajectory in its monthly price.
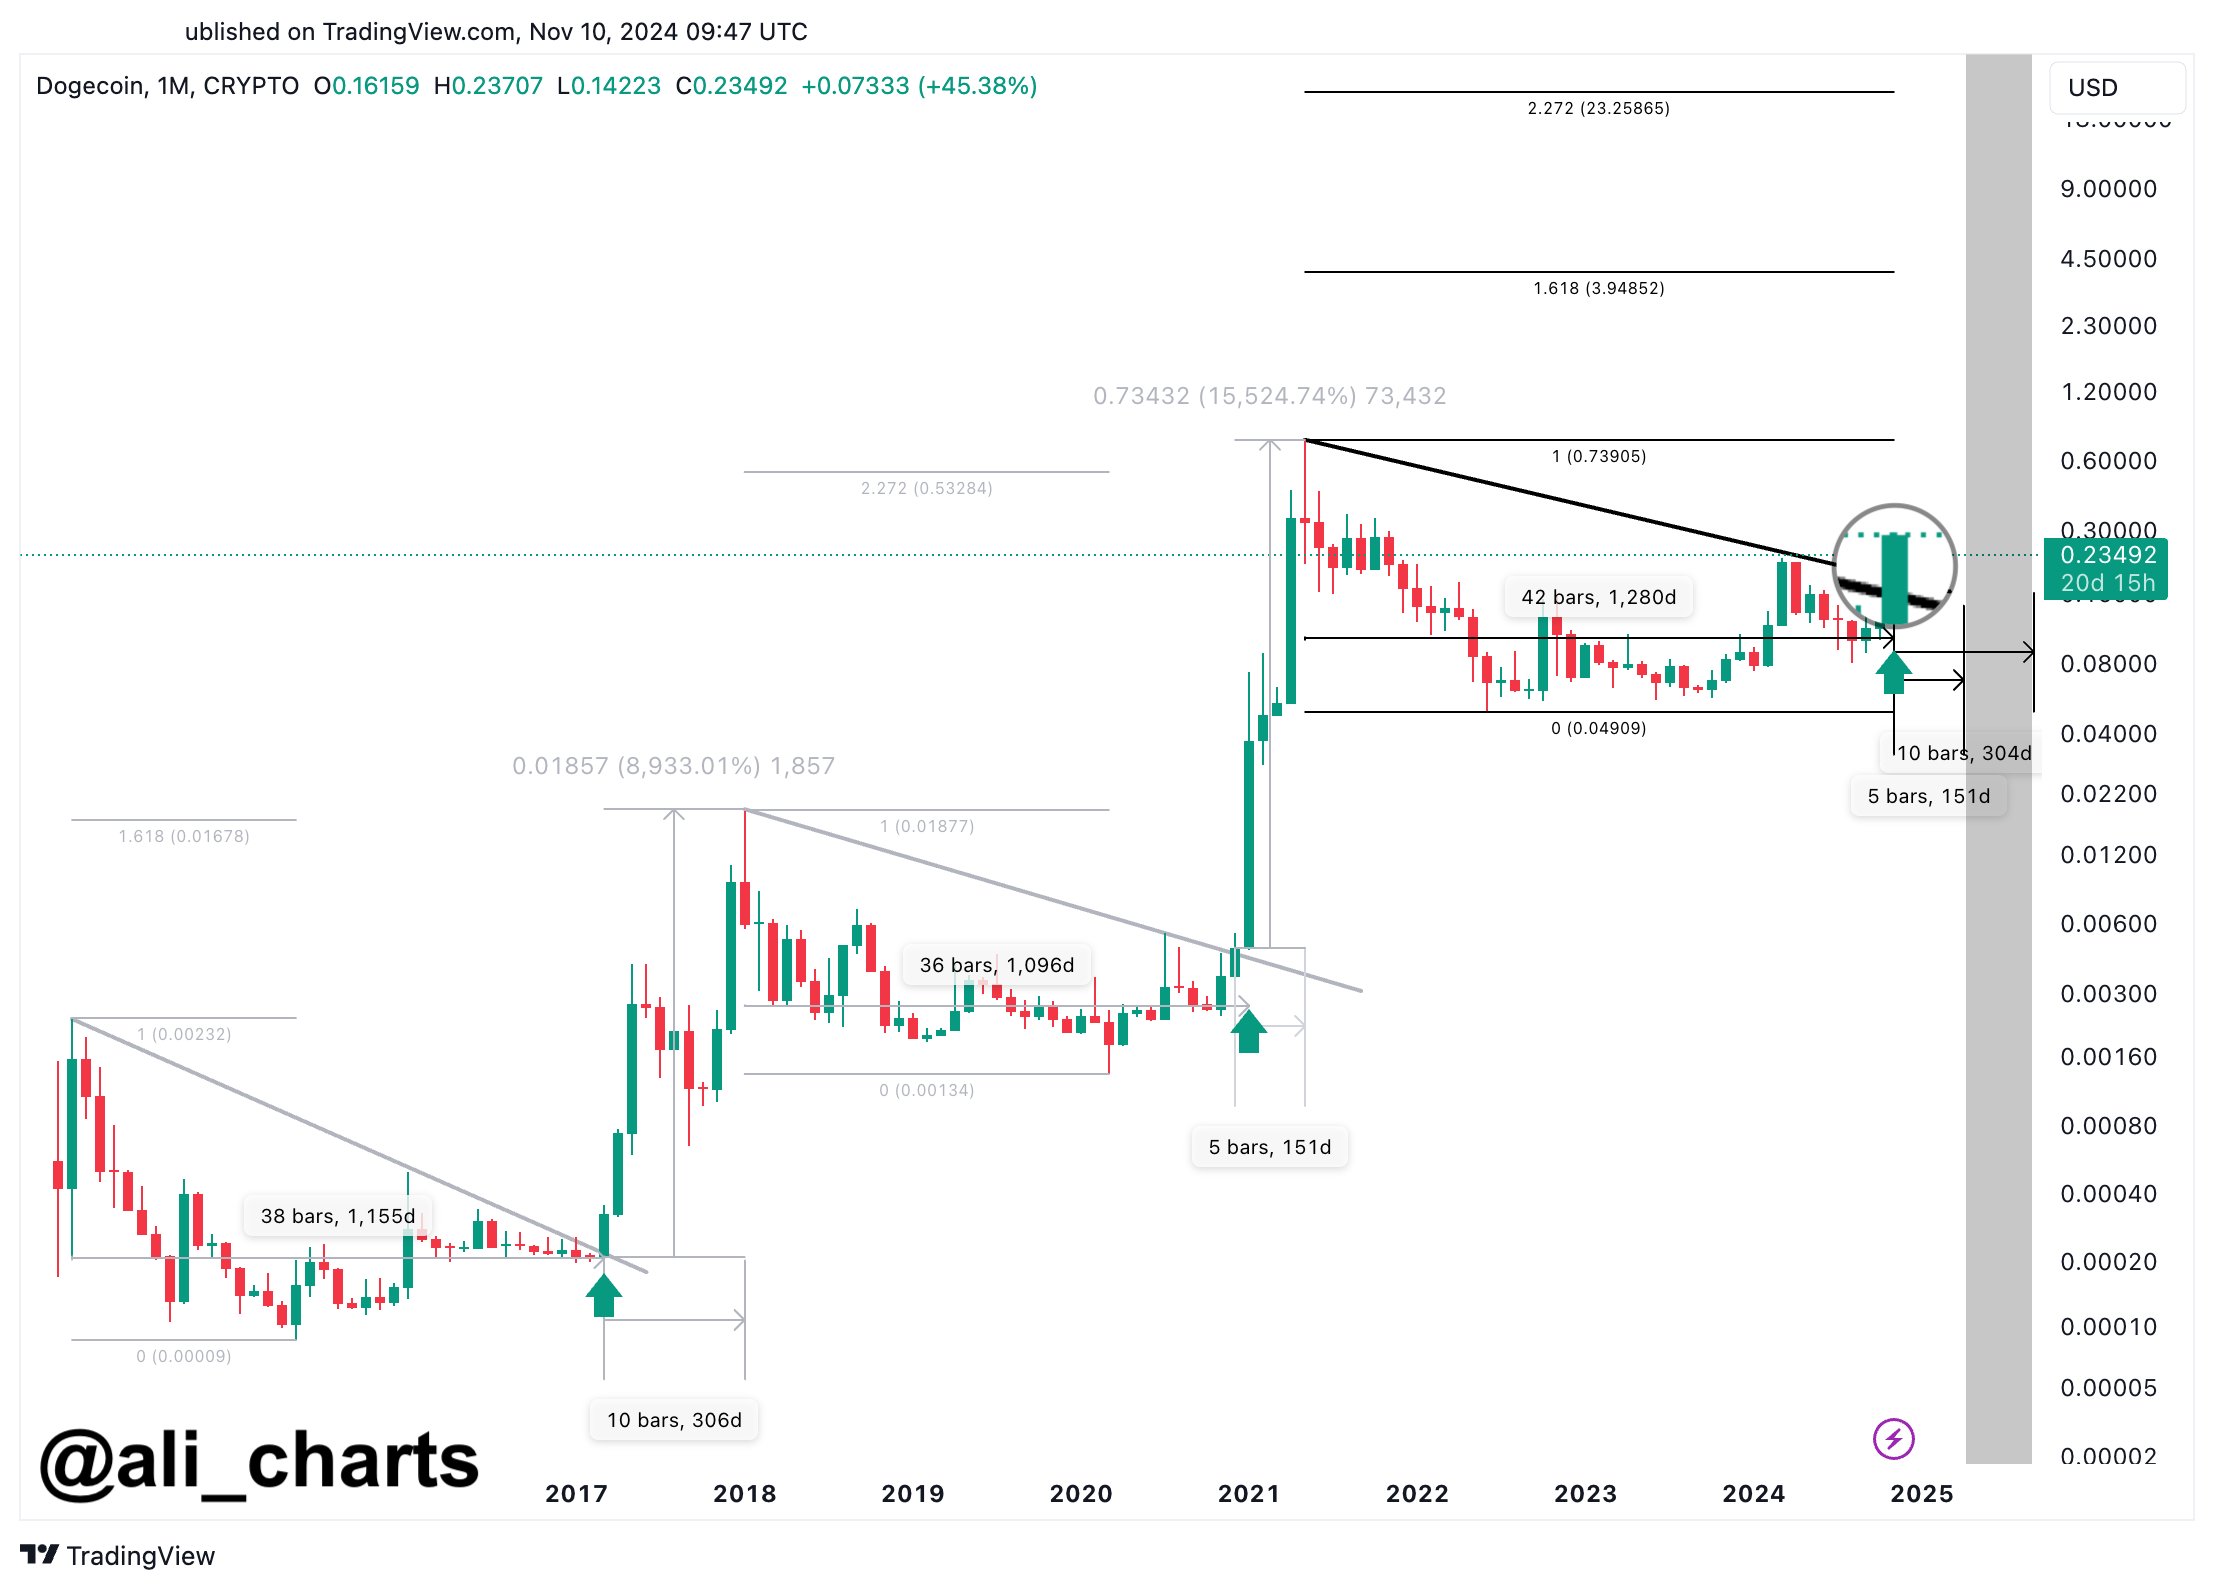
From the graph, it’s visible that Dogecoin had been trading inside a Descending Triangle pattern during the last few years, but the coin appears to have found a break above it recently. The Descending Triangle is a pattern in technical analysis (TA) that, as its name suggests, looks like a triangle slopped downwards. Generally, the bottom line of the triangle provides support to the asset’s price, while the top one can be a source of resistance.
A break out of either of these lines can signal a continuation of trend in that direction. Thus, escapes out of the upper level, like the one that the memecoin has seen recently, can lead to a bullish outcome.
As Martinez has highlighted in the chart, this isn’t the first time that Dogecoin has seen a long-term phase of consolidation inside a Descending Triangle. It would appear that the previous two such patterns also saw the cryptocurrency achieve breaks to the upside.
Both of these breaks led to sharp bull runs for the coin, so it’s possible that the latest surge in the price is the start of something similar. As for how high DOGE might be able to go this time, the analyst has referred to Fibonacci levels. These levels are based on different ratios from the popular Fibonacci series. The first bull run topped out around the 1.618 Fibonacci level, which corresponds to the famous golden ratio that’s found in many natural formations.
The second one saw the cryptocurrency go through a larger jump, with its top being situated around the 2.272 level as measured from the top of the last bull run (corresponding to 1.000).
Based on these tops, Martinez believes that the top of the next Dogecoin bull run might lie somewhere between the two levels. Relative to the last bull run top, the 1.618 lower cutoff of the range translates to around $3.95, while the upper 2.272 one to about $23.26.
If Dogecoin can manage to touch even the first of these targets, its price would have seen growth of over 1,310% from where it’s today.
DOGE Price
At the time of writing, Dogecoin is trading at around $0.285, up 86% over the last seven days.


