Bonk has taken a downturn, sliding toward the crucial $0.00002635 price mark as bearish forces take charge. This level could be the bulls’ last stand to regain momentum and prevent a deeper correction.
With market sentiment hanging in the balance, all eyes are on whether buyers can mount a comeback at this pivotal support. A successful defense could spark a bullish reversal, bringing fresh optimism to Bonk’s price trajectory. But if the bears hold strong, the path forward may grow more challenging.
This analysis aims to examine the meme coin’s recent price movement as it approaches the $0.00002635 support level, assessing whether this key point could spark a potential trend rebound. By analyzing technical indicators, market sentiment, and historical price patterns, this article seeks to provide insights into whether upbeat pressure can reassert itself at this level or if further bearish pressure could drive the price lower.
Analyzing Bonk’s Price Trends And Recent Downward Shift
Recently, despite staying above the 100-day Simple Moving Average (SMA), Bonk has shifted into a bearish phase on the 4-hour chart. After facing resistance at $0.00004002, the price has pulled back toward $0.00002962. This retreat indicates increasing negative pressure, with sellers gaining control. If the price fails to hold at $0.00002962, more declines could follow, possibly testing lower support levels.
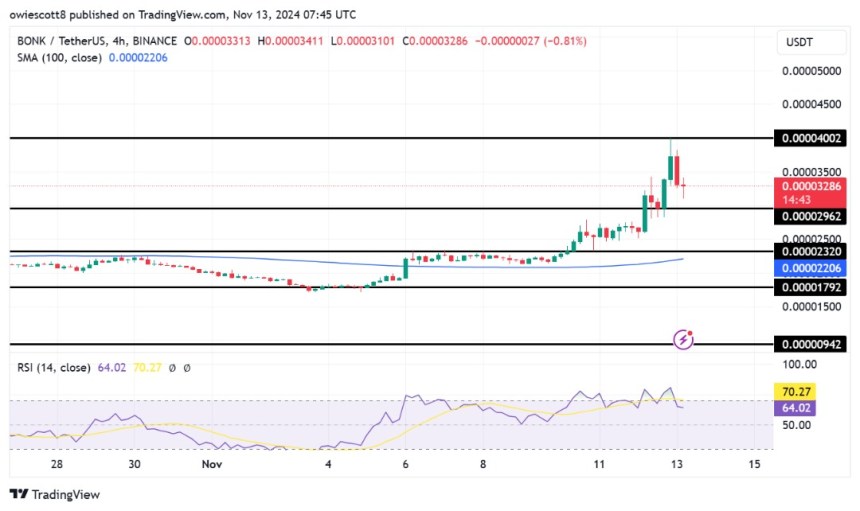
Also, the 4-hour Relative Strength Index (RSI) has fallen from 80% to 63%, signaling a decline in bullish momentum. As the RSI approaches neutral territory, buying pressure has eased, and market confidence in the uptrend is diminishing. Specifically, this change suggests that BONK may be entering a correction phase, with the potential for further downward movement should the trend persist.
On the daily chart, after facing resistance at $0.00004002, BONK is exhibiting a growing pessimistic sentiment. A negative candlestick pattern and a decline toward $0.00002962 highlight increasing selling pressure as the meme coin struggles to maintain higher levels. This implies that market momentum is shifting, and BONK may face additional downside pressure if it fails to stabilize.

Finally, on the 1-day chart, the RSI has dropped from 82% to 67%, signaling a possible shift in momentum suggesting fading buying pressure and a transition from an overbought condition to a more neutral or bearish phase. As the RSI moves further from overbought levels, it indicates weakening upward strength, with sellers possibly gaining control, which could lead to a price correction or consolidation.
Navigating The Downturn: Can Bulls Push Back Bonk From Here?
As the market faces a downturn and the price drops toward $0.00002962, the critical question is whether bulls can regain control and reverse the trend or if bearish pressure will continue pushing the price lower. If BONK reaches this support level and the Bulls can successfully defend it, a rebound could follow, potentially driving a resurgence toward $0.00004002 and beyond.
However, failure to defend this support could signal more declines, which could target lower levels, such as $0.00002320 and beyond.


