The Bitcoin price has been quite indecisive in its action over the past week, jumping between the $117,000 and $120,000 consolidation zone in that period. The flagship cryptocurrency, however, came tumbling toward the $115,000 mark following massive coin movements toward centralized exchanges in the past day.
Interestingly, a prominent market expert has put forward an even more bearish outlook for the Bitcoin price over the next few weeks. With this latest projection, the price of BTC seems to only be at the beginning of a downward spiral, which could worsen over the coming days.
How BTC Price Could Be At Risk Of Extended Decline
In a July 25 post on social media platform X, Chartered Market Technician (CMT) Aksel Kibar painted a bearish picture for the Bitcoin price after falling to $115,000 on Friday. According to the analyst, the flagship cryptocurrency could be on its way to around $109,000 in the coming days.
Kibar’s bearish stance revolves around the inverse head-and-shoulder pattern on the Bitcoin price chart on the weekly timeframe. The inverse head-and-shoulders pattern is a technical analysis formation characterized by three distinct price troughs, including a lower “head” set between two higher “shoulders.”
Typically, the inverse pattern signals a possible bullish breakout and is validated when the price breaches the neckline — a trendline connecting the crests (swing highs) between the head. As shown in the chart below, the Bitcoin price has already broken through the neckline to reach a new all-time high.
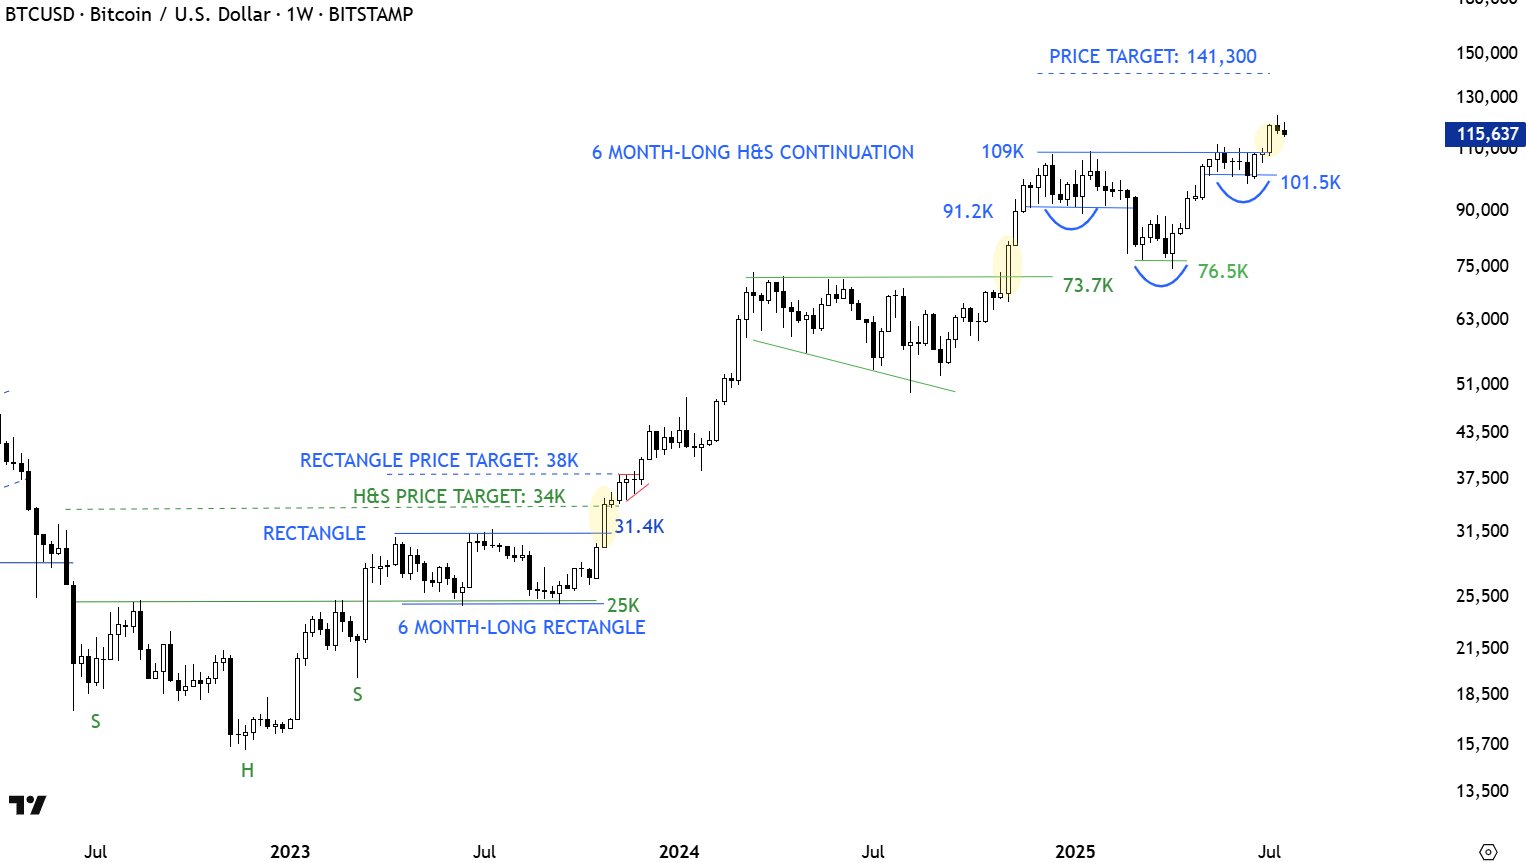
However, Kibar explained that the price breakout witnessed by Bitcoin might not be the textbook breakout typically expected in most inverse head-and-shoulders pattern scenarios. According to the market expert, most head-and-shoulder breakouts are followed by pullbacks and retests rather than straight rallies.
Chart data provided by the analyst shows that, since May 2017, the Bitcoin price has witnessed a retest or pullback (type 2 continuation) more times than a straight rally (type 1 continuation) after a head-and-shoulder pattern breakout. This trend explains the rationale behind Kibar’s bearish projection for BTC in the next few days.
If the price of Bitcoin does suffer a deeper correction as in the type 2 continuation, it is likely to return to the neckline — and around the $109,000 mark. A move like this would represent an over 5% decline from the current price point.
Bitcoin Price At A Glance
After a horrendous start to the day, the market leader seems to be recovering nicely from its recent fall to $115,000. As of this writing, the price of BTC stands at around $117,323, reflecting a mere 0.6% decline in the past 24 hours.


