Bitcoin reached a historic milestone today, touching $124,500 and setting a new all-time high that initially fueled hopes of a strong bullish continuation. The breakout above previous resistance levels ignited optimism among traders and investors, who saw it as a potential launchpad for the next leg of the rally. However, the euphoria was short-lived — BTC quickly retraced to $121,500, sparking debate about whether the market could be on the verge of a deeper correction.
According to data from CryptoQuant, the Net Unrealized Profit/Loss (NUPL) metric is behaving differently compared to past market cycles. In prior bull runs, NUPL peaks often coincided with overheated conditions and sharp reversals. This time, however, the indicator’s trajectory suggests a more gradual and measured climb, reflecting a shift toward a more evolved and institutionalized market structure. Analysts attribute this change to the increasing presence of long-term investors and the impact of US-based spot Bitcoin ETFs, which have helped smooth volatility and reduce extreme profit-taking events.
While BTC’s long-term outlook remains bullish, the coming sessions will be crucial in determining whether this pullback is a healthy reset or the start of a broader correction. Traders are now watching both price action and NUPL trends for clues on the next decisive move.
Bitcoin NUPL Data Points to Unique Cycle Structure
According to analyst Yonsei Dent, the Net Unrealized Profit/Loss (NUPL) metric remains one of the most telling on-chain indicators for assessing market sentiment and cycle positioning. NUPL measures the proportion of coins in profit versus loss.
Historically, market cycle tops have coincided with NUPL peaks. In the 2017 cycle, the metric formed a single major peak before a sharp reversal. In 2021, it produced two distinct peaks, each aligning with a wave of overheated price action and subsequent corrections.
In the current cycle, NUPL appears to be attempting a third peak, a behavior not seen in previous bull runs. Unlike past cycles characterized by sharp, singular blow-off tops, the present market is advancing in stepwise waves. Dent attributes this structural change largely to the influx of institutional capital, driven in part by the growth of US-based spot Bitcoin ETFs.
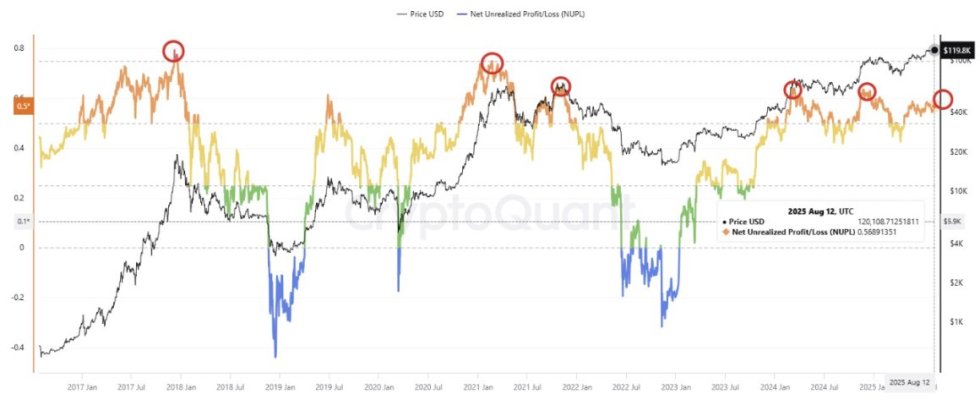
This institutional presence has increased the market’s size, liquidity, and stability, but has also moderated extreme percentage gains seen in prior rallies. While this environment could extend the duration of the bull market, it also suggests a reduced likelihood of short-lived, overheated surges.
In practical terms, this means the market may see longer, more sustained uptrends with shallower corrections, rather than the volatile boom-and-bust patterns of earlier cycles. Traders and investors watching NUPL closely will be looking for whether this potential third peak forms fully — and if it signals a more tempered, but prolonged, phase of Bitcoin’s growth.
Resistance Rejection At New All-Time High
On the 12-hour chart, Bitcoin (BTC) is trading at $121,596, down 1.37% after briefly touching $124,501 — a new all-time high. This move marks another test of the $123,217 resistance level, which has acted as a ceiling for price action. The sharp rejection from above this zone suggests strong selling pressure at higher levels, at least in the short term.
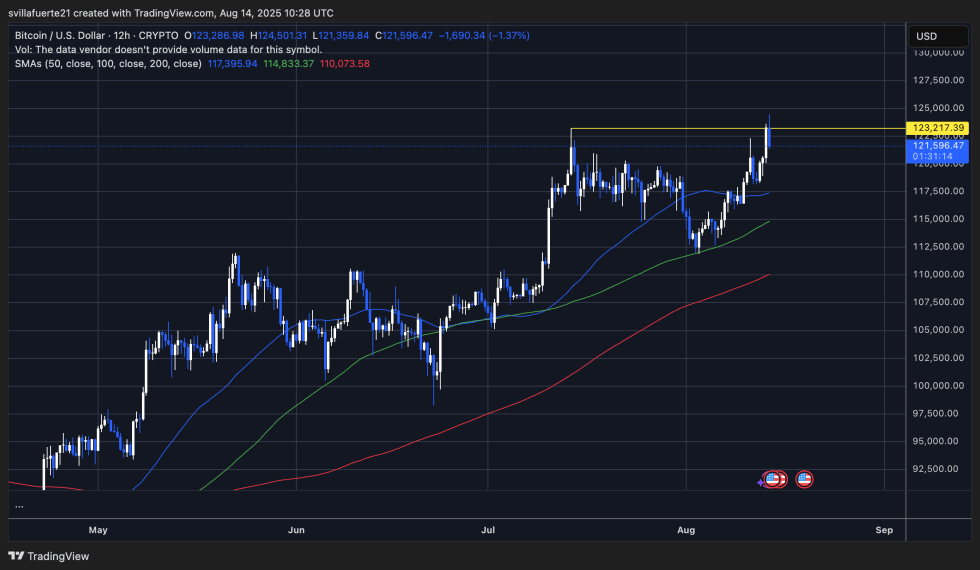
Despite the pullback, BTC remains in a clear bullish structure, holding well above its 50 SMA ($117,395), 100 SMA ($114,833), and 200 SMA ($110,073). These moving averages are rising, reflecting strong underlying momentum. The recent surge from early August lows near $113,000 shows that bulls still control the medium-term trend.
The $123K–$124K area remains the critical breakout zone to watch. A confirmed close above $124K could open the door to further gains and trigger momentum buying, potentially leading to new price discovery. On the downside, immediate support lies near $120K, followed by stronger support at $117K, where the 50 SMA aligns with previous consolidation.
Featured image from Dall-E, chart from TradingView


