XRP is pressing against a structurally important ceiling at roughly $3.10, and a clean breach could open the way to $9, according to crypto analyst The Great Mattsby (@matthughes13). In a video analysis published on October 5, the analyst anchors his outlook in multi-cycle Fibonacci extensions, Ichimoku trend support and long-term moving averages, arguing the market is staging an unusually strong basing pattern at historically elevated levels.
XRP On The Verge Of A $9 Explosion
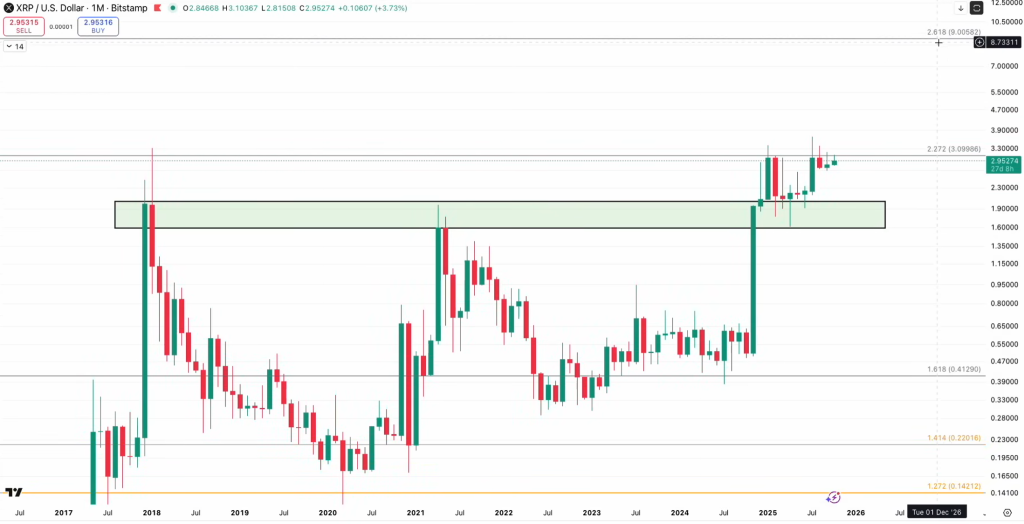
At the core of Mattsby’s framework is a Fibonacci extension suite calibrated from the December 2013 top to the July 2014 bottom. He highlights the 2.272 extension—around $3.09986—as the decisive resistance that has repeatedly capped monthly closes.
“XRP is still battling… this $3.10 zone. This is the 2.272 Fibonacci extension level… we’ve never seen a monthly candle close above that 309986,” he said, noting that the same extension grid “was the exact 2018 top,” while “extensions below the 1.272 was the bottom in April 2020.” On his read, the confluence lends credibility to the next extension target: “The next level is $9… So essentially, it’s only a matter of time.”
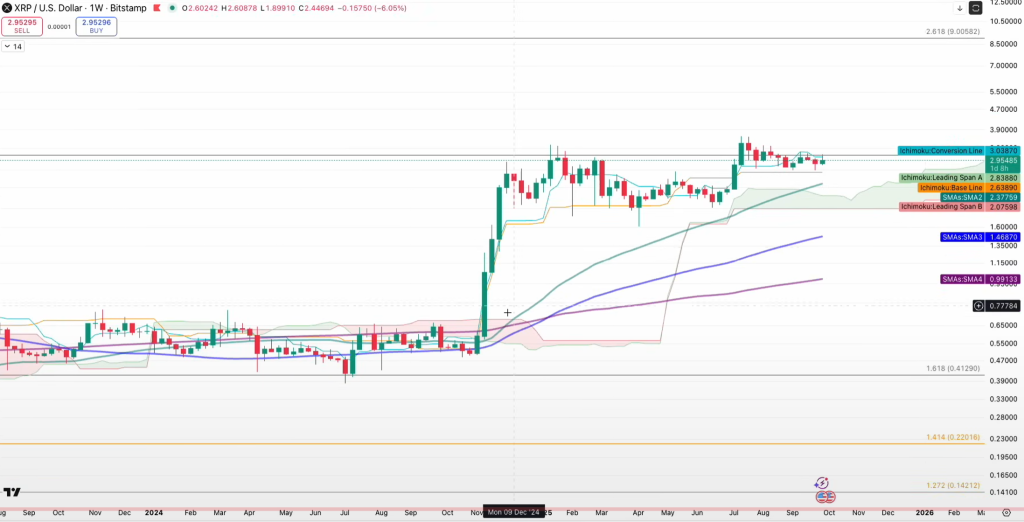
Trend metrics, he argues, have supported the advance without breaking structure. On the monthly timeframe, XRP has “been maintaining and riding [the Ichimoku] conversion line as a support ever since it broke out in November of last year.” He identifies that conversion line near $2.63 and emphasizes that “it has never closed any kind of monthly candle below it.”
On the weekly chart, he points to the 50-week simple moving average—now near $2.37—as still “catching up to price,” one of the few large-cap altcoin charts, in his view, that “has never even touched the 50-week moving average since it broke out.” That gap, he suggests, explains the rhythm of ongoing consolidation while preserving an underlying uptrend.
XRP Has Never Done This Before
The market structure, Mattsby contends, is constructive: a breakout, retest and series of higher highs and higher lows at elevated levels. On the highest-level view, he frames the price action as a regime shift from resistance to support across cycles. “This is the previous resistance zone… 2021 it was the top. 2017–2018 it was the top—not including the wicks. But now this box we are actually just flipping it to support, building a base on top of it,” he said. He called that flip “the most bullish thing ever on any chart,” adding, “This has never happened for XRP.”
Mattsby repeatedly returns to the same trigger: a decisive monthly close through the $3.10 area. “We should be excited because once this $3.10 gets broken, it’s going to go higher, right? It’s going to go to probably $9, maybe even higher, maybe $13, maybe more,” he said.
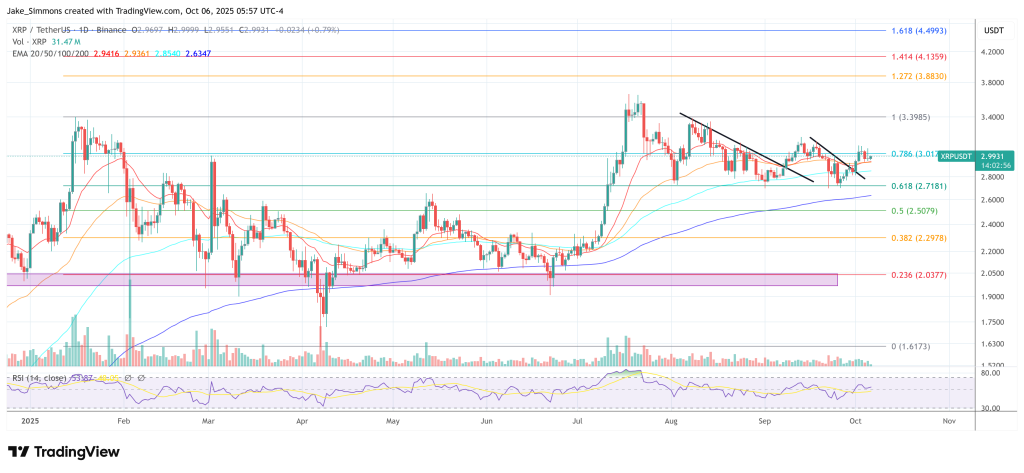
While he allows for “more weeks of consolidation” and even a liquidity sweep into the “$2.80s, $2.70s,” he argues those moves would be noise within a larger uptrend defined by compression against the $3.10 lid and the stair-step advance of trend supports. “It’s not if, it is when. Because this is a super bullish chart,” he said, urging viewers to “Watch $3.10… Once that breaks, the true excitement can begin.”
In practice, the roadmap he lays out is simple: protect the long-term trend markers while the 50-week average closes the distance, keep monthly structure above the Ichimoku conversion line near $2.63, and respect the historical importance of the $3.10 extension.
A monthly close through that level would, in his framework, confirm the next Fibonacci waypoint at $9. “One of these weeks we might be able to see a bullish engulfing candle just breaking through multiple levels and just continuing higher,” he said. Until then, he characterizes the price action as a high-level base “building… for almost a whole year,” an atypically strong setup for XRP across its multi-cycle history.
At press time, XRP traded at $2.99.