Bitcoin continues to trade around the $110,000 level, unable to reclaim higher ground after weeks of volatile price action. The market is still digesting the impact of the October 10 flash crash, which erased billions in open interest and sent shockwaves across altcoins. Despite a gradual recovery in on-chain metrics and institutional inflows, sentiment remains fragile, with traders hesitant to take new long positions.
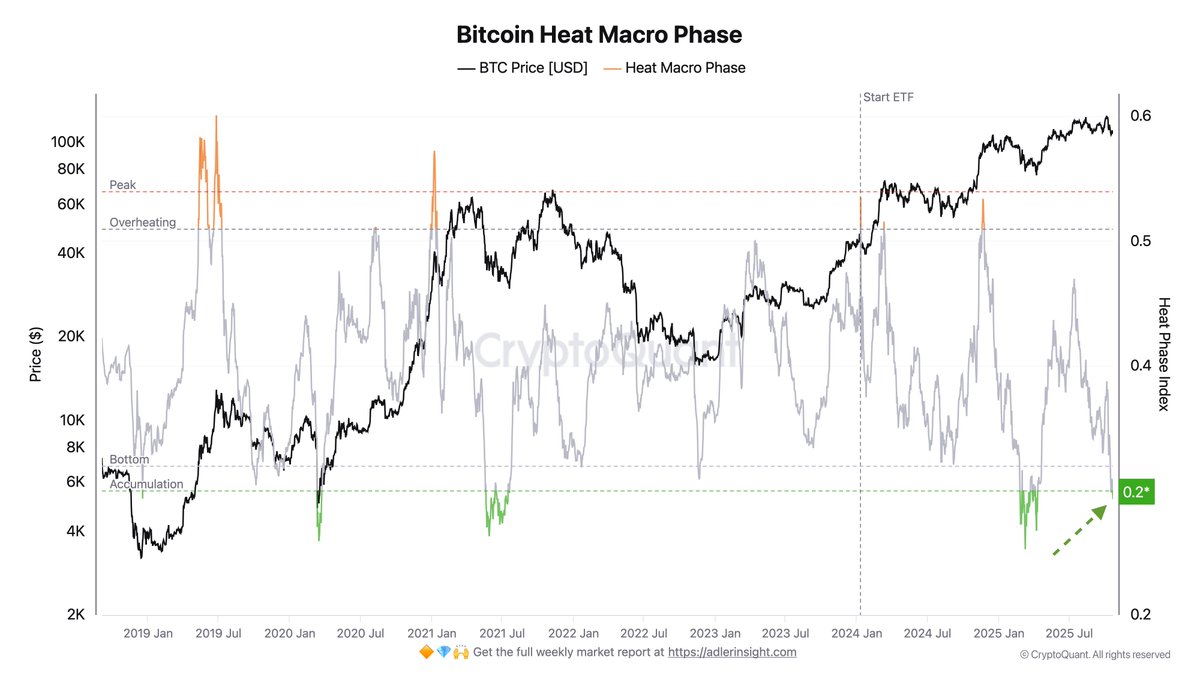
According to top analyst Axel Adler, the Bitcoin Heat Macro Phase — a key indicator used to measure speculative pressure and market overheating — has now entered the Bottom or Accumulation zone. This signals a cooling-off period in speculation, suggesting that short-term trading activity is fading while long-term accumulation quietly resumes.
However, Adler warns that this phase requires stability to play out effectively. For Bitcoin to initiate a sustainable rally, volatility must continue to decrease, and no major macro shocks — such as a surge in gold or US bond demand — should disrupt the current equilibrium. The coming weeks may define whether BTC consolidates or slips into renewed risk-off territory.
Bitcoin Accumulation Signals Strength, But Stability Is Key
Axel Adler explains that when the Bitcoin Heat Macro Phase drops into the Bottom or Accumulation zone, it often represents a pivotal moment within a broader bull market. Historically, such readings coincide with periods where speculative pressure fades, leverage resets, and market participants begin quietly accumulating positions ahead of the next growth phase. These zones tend to appear after major corrections, when weak hands exit and the market regains structural balance — a necessary condition for sustained recovery.
This phase reflects a shift from emotional trading to strategic accumulation. During these stages, on-chain activity typically shows increased wallet balances among long-term holders, while short-term traders reduce exposure. However, for this accumulation to translate into a meaningful rally, one critical condition must be met: volatility must decline. High volatility implies uncertainty and risk aversion, discouraging new capital inflows. A gradual cooling of volatility creates the stability needed for market confidence to rebuild.
The analyst emphasizes that Bitcoin’s current setup requires at least a short stretch — roughly a week — without major negative global catalysts. External shocks such as surging bond yields, geopolitical tension, or renewed macro risk-off sentiment could easily disrupt the fragile recovery process.
In essence, the market appears to be in a delicate balance: the speculative cycle has cooled enough to allow accumulation, but stability remains the missing piece for momentum to return. If volatility continues to decline and macro conditions hold steady, this accumulation phase could serve as the foundation for Bitcoin’s next major rally, mirroring previous transition points seen in past bull cycles.
Price Action Details: Testing Key Level
Bitcoin is currently trading near $110,936, struggling to gain momentum after several failed attempts to reclaim higher levels. The 4-hour chart shows a period of consolidation following the sharp recovery from the October 10 crash, with BTC moving in a tight range between $108,000 and $112,000. This structure reflects indecision in the market as buyers and sellers battle for short-term control.

The 50 EMA (blue) is attempting to cross above the short-term range, signaling some recovery in short-term momentum. However, Bitcoin remains below both the 100 EMA (green) and the 200 EMA (red), indicating that the broader trend is still under bearish pressure. The $111,000–$112,000 zone is acting as immediate resistance, while $108,000 serves as critical short-term support.
If Bitcoin manages to break above the $112,000 resistance with volume confirmation, it could trigger a push toward the $117,500 level — the key horizontal resistance aligned with previous liquidity clusters. Conversely, rejection at this level may lead to another pullback toward $106,000 or lower, especially if volatility increases.
Featured image from ChatGPT, chart from TradingView.com


