Bitcoin’s bearish momentum has since reached a cool-off state, as price maintains above the last swing low established late November. However, although there has been a steady uptrend, signs of a bullish reversal remain weak. Interestingly, a recent evaluation has been published, which delves into the factors that may affect Bitcoin’s next major move.
Analyst Points To Key Support, Resistance Zones Using MVRV Metric
In an X post released on December 12, market analyst Ali Martinez shares that Bitcoin’s next significant move depends on how the price acts around a set of identified critical levels using data from the MVRV Extreme Deviation Pricing Bands. For context, this metric is used to identify when Bitcoin is undervalued or overvalued, with past activity around certain levels being a defining factor. It serves this function by comparing Bitcoin’s market price to its Realized Price and plotting extreme levels of likely deviation, such as ±0.5 and ±1.0, around the realized price.
From the chart below, $99,000 stands in correspondence to the +0.5 standard deviation band. This price level has historically functioned as a local top, especially in resistance against short-term bullish momentum. This happens because there is an increase in profit-taking among sellers, as they are prone to exiting in the presence of any real opposition. Interestingly, a significant break above this $99,000 resistance level could be a sign of awakening bullish interest, potentially causing the inflow of bullish momentum upon its retest.
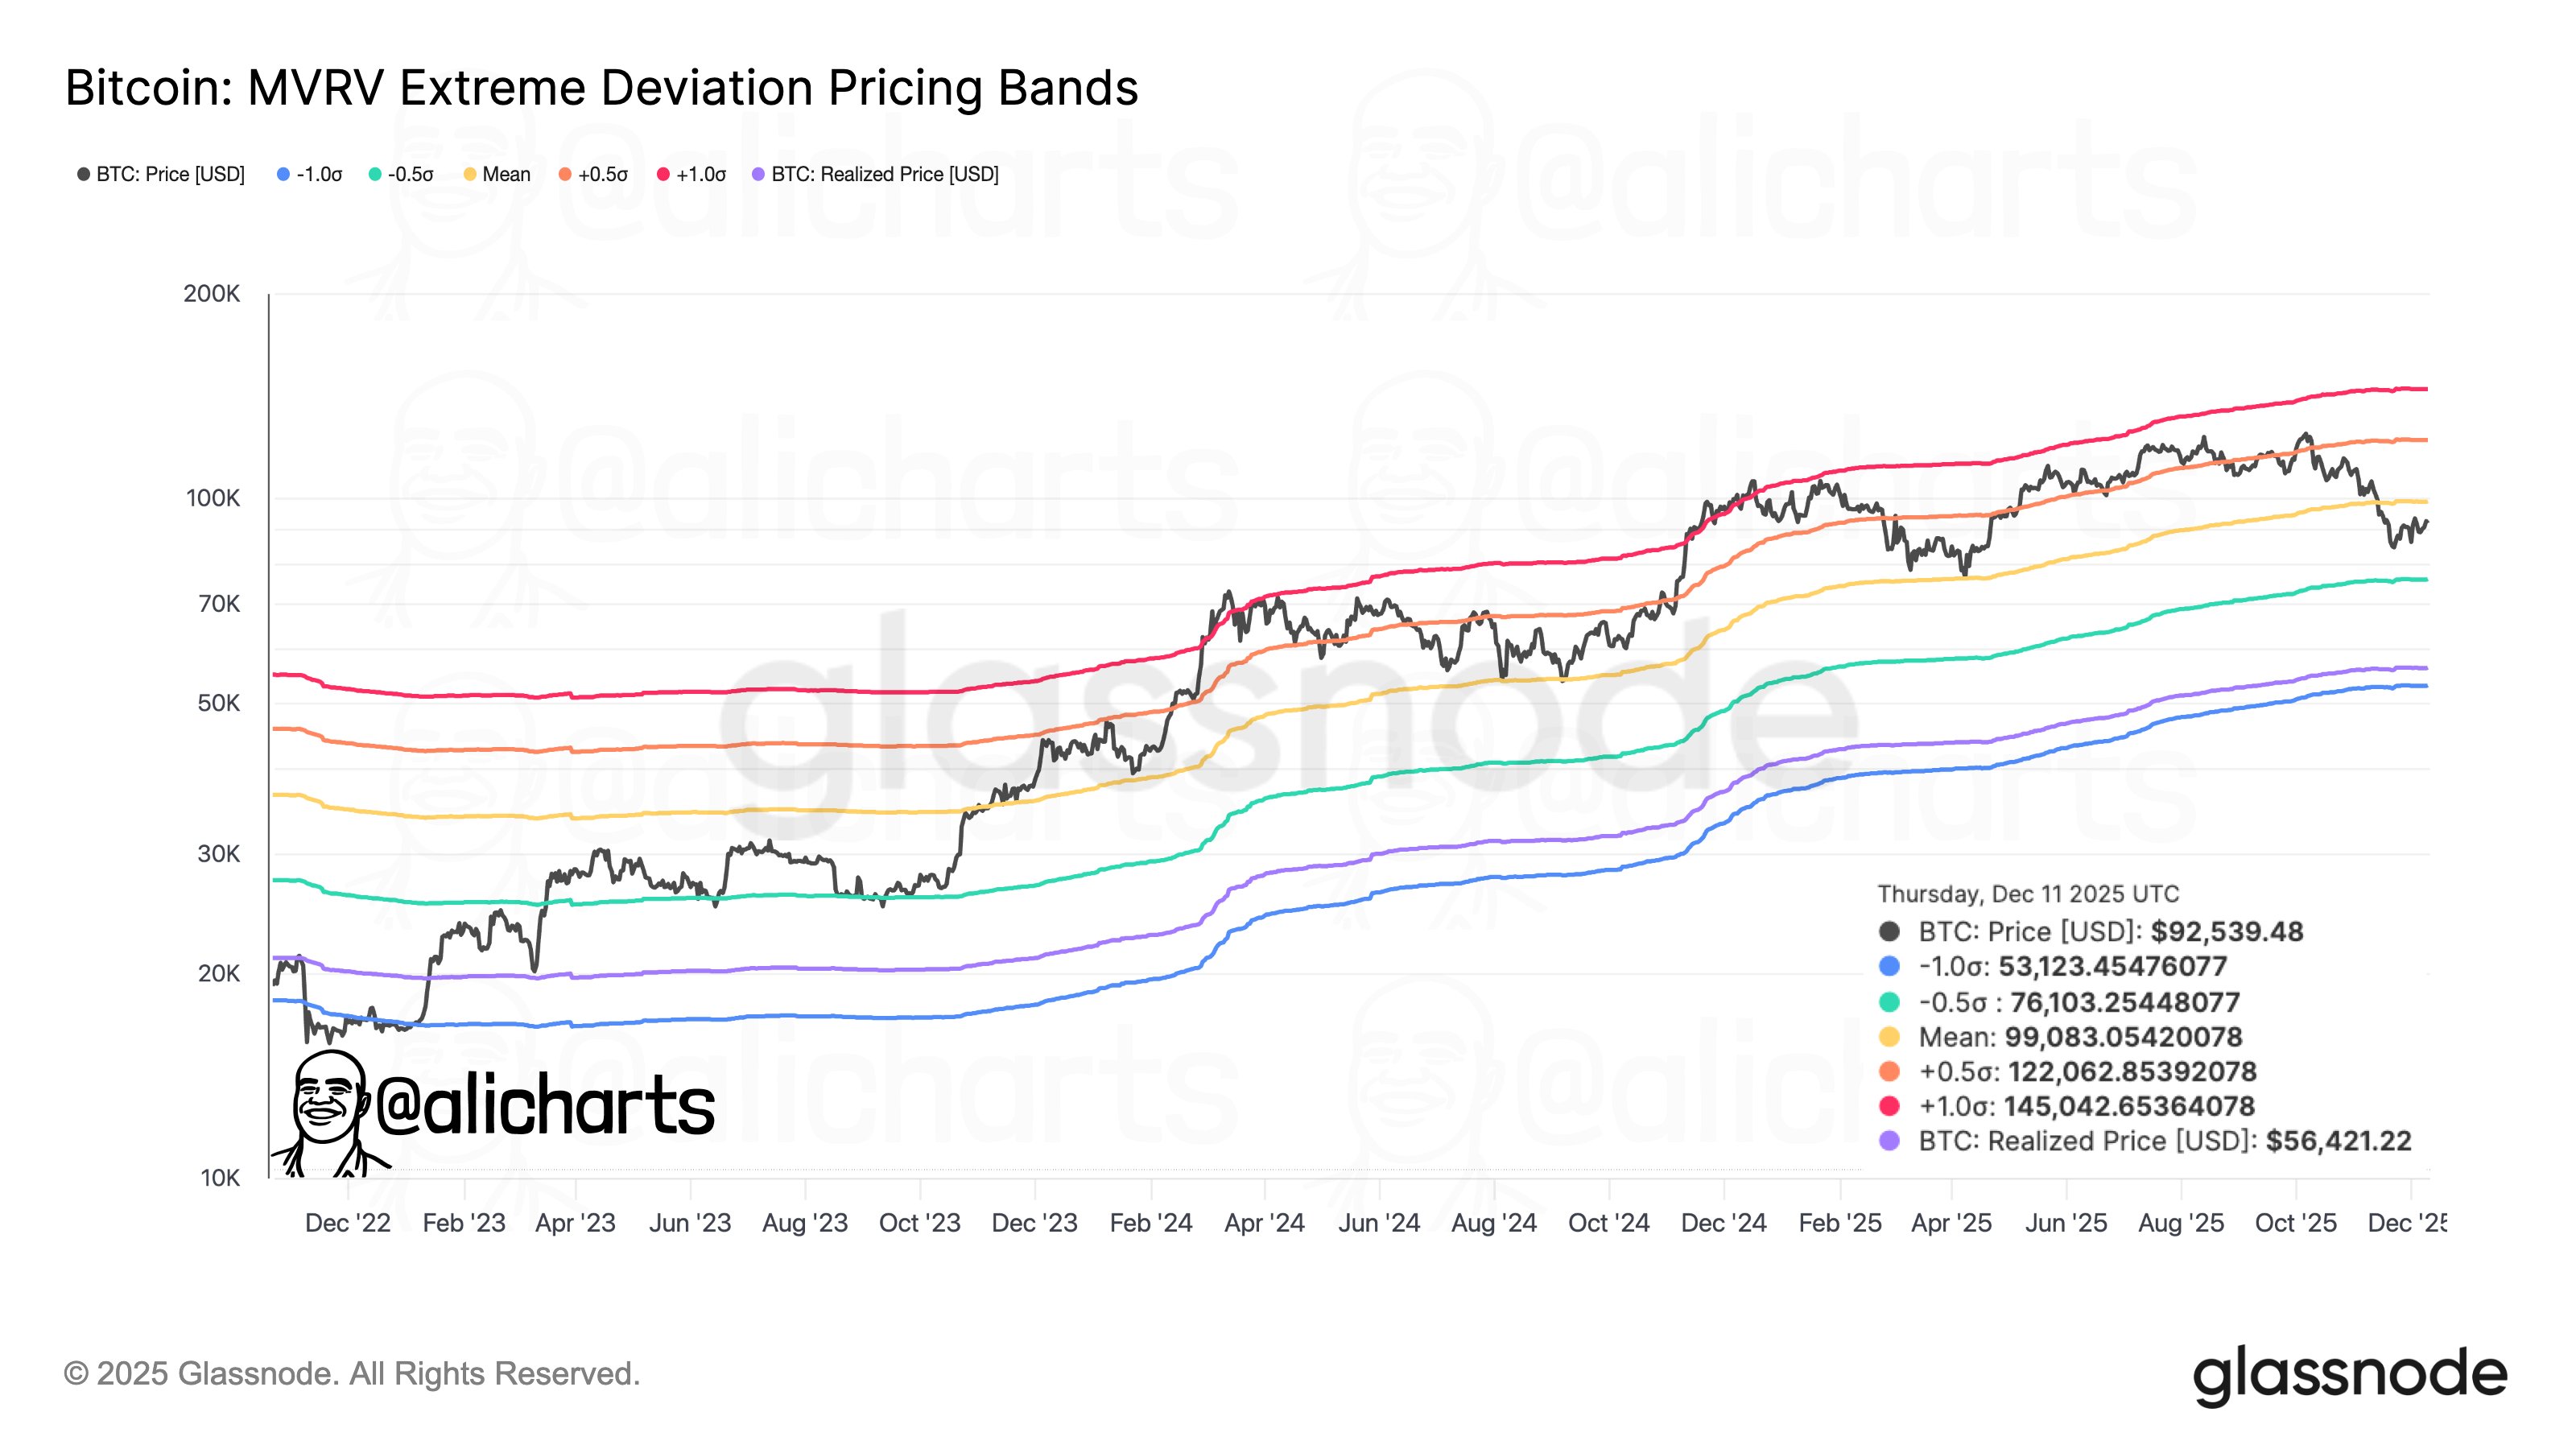
On the flipside, the most immediate support zone is seen to lie around the $76,000 price. Notably, this region corresponds to the –0.5 deviation band, suggesting that it is a price level where Bitcoin would become undervalued if reached.
Past market cycles also reveal that pullbacks into this price region have often preceded increased upward momentum, owing to the ‘buy-the-dip’ mentality that must have prevailed. Expectedly, a slip beneath this key support zone would be a result of intensified sell pressure within the market. When this development occurs, the Bitcoin price could see an even deeper correction towards the south side of the price.
Metric Suggests $122,000 And $53,000 Are Next Crucial Zones To Watch
Notably, Bitcoin is expected to face another battle in the scenario where it breaks above the $99,000 resistance. Readings from the metric reveal that the +1 standard deviation band stands roughly at $122,000. Bullish rallies have often reached this price region, with significant resistance met to send prices sharply downwards. A break above the +1.0 deviation could therefore precede the formation of a new all-time-high price.
Also, the –1.0 deviation stands at the $53,000 price level. If the –0.5 deviation were to fail, the Bitcoin price could begin a bearish cycle towards $53,000, as it stands as the next significant support. This is so because it has historically functioned as a strong accumulation zone, where a bit of sideways movement was seen before major price expansions followed. At press time, Bitcoin stands at approximately $90,400, with a loss of %1.24 recorded since the last day, per CoinMarketCap data.


