Bitcoin Price Prediction – January 20
The Bitcoin price prediction reveals that BTC may begin to restart towards the upside after touching the daily low of $41,660.
BTC/USD Long-term Trend: Ranging (Daily Chart)
Key levels:
Resistance Levels: $48,000, $50,000, $52,000
Support Levels: $38,000, $36,000, $34,000
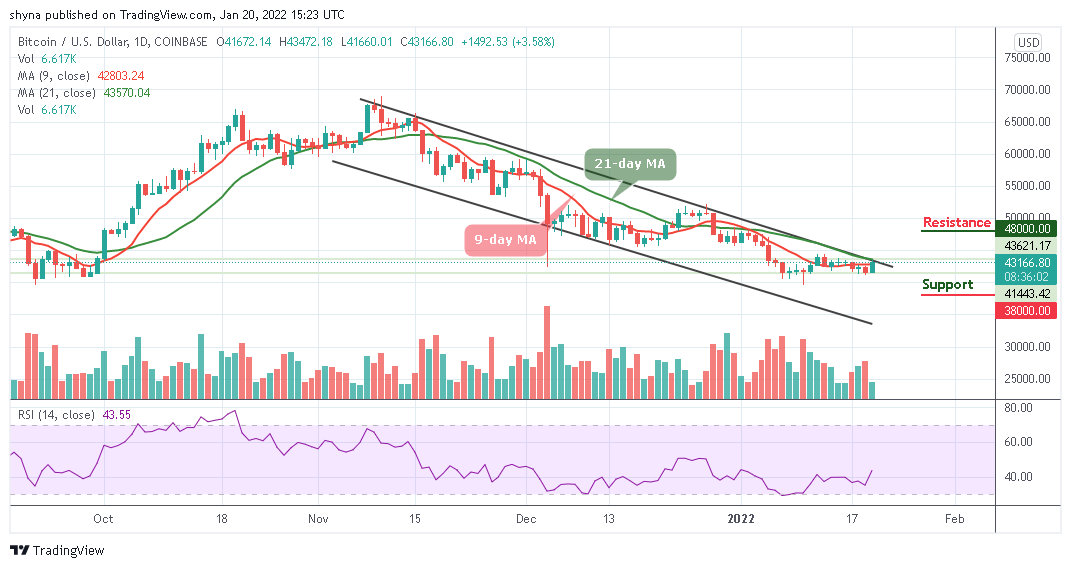
BTC/USD looks green today as the price hovers above the resistance level of $43,000 from the low of $41,660. However, a daily close above this level may increase the Bitcoin price to $45,000. In addition, traders should note that a consistent price increase may bring more buyers into the market as bulls increase their positions.
Bitcoin Price Prediction: Price May Push Higher
In the past few hours, after the Bitcoin price touches the daily high of $43,472, the first digital asset is now looking forward to touching another resistance level of $44,000. At the time of writing, the daily chart reveals that if the 9-day moving average crosses above the 21-day moving average, it will keep the coin at the upside.
Meanwhile, the bears may take advantage to break below the 9-day moving average if the bulls fail to move the price above the upper boundary of the channel. Meanwhile, the technical indicator Relative Strength Index (14) is crossing above 40-level. More so, if the Bitcoin price crosses above the moving averages, it could hit the resistance levels of $48,000, $50,000, and $52,000 but facing the south may locate the supports at $38,000, $36,000, and $34,000.
BTC/USD Medium – Term Trend: Ranging (4H Chart)
According to the 4-hour chart, the Bitcoin price is hovering above the 9-day and 21-day moving averages. However, intraday trading is ranging as the coin moves toward the upper boundary of the channel which could reach the resistance level at $44,000 and above.
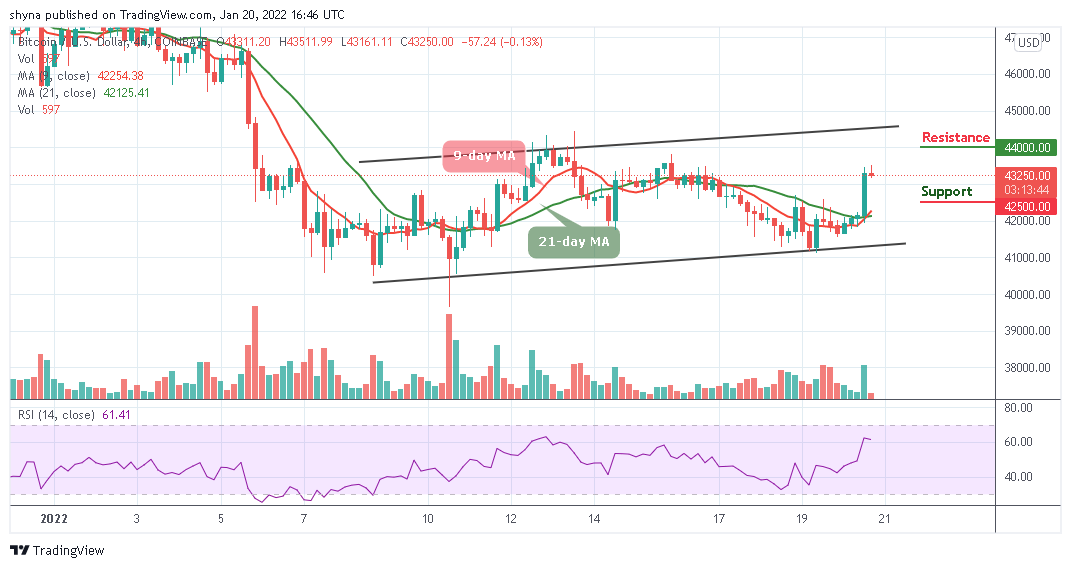
On the contrary, if the sellers push the market downward, traders can expect a fall below the moving averages, breaking this barrier may further bring the price to reach the support level of $42,500 and below. Meanwhile, the technical indicator Relative Strength Index (14) is seen moving above 60-level, suggesting more bullish signals.
Read more:


