TerraUSD Price Prediction – May 14
Since the inception of the UST/USD market has been under a bearish trading outlook. The situation has not differed until now as the UST economy is trading in a deep-shallow zone against the trade worth of the US Dollar within $0.18 and $0.15 at a minute negative percentage of 0.46.
TerraUSD Market
Key Levels:
Resistance levels: $0.30, $0.50, $0.70
Support levels: $0.10, $0.075, $0.050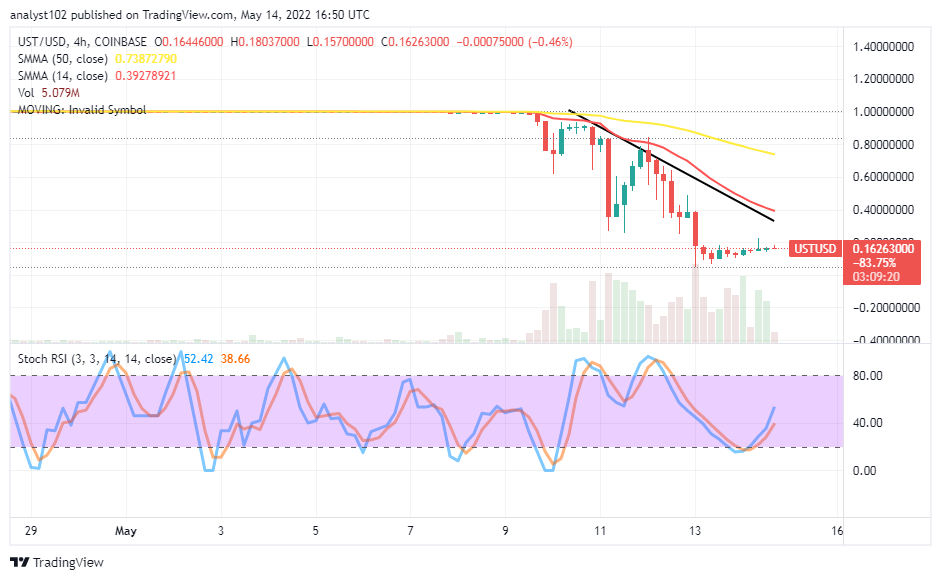 UST/USD – Daily Chart
The daily chart showcases the UST trade operation is trading in a deep-shallow zone against the US Dollar purchasing strength underneath the trend lines of the SMAs. The 14-day SMA indicator is underneath the 50-day SMA indicator. The Stochastic Oscillators have briefly swerved northbound from the range of 20 against the 40 range. And a line of smaller candlesticks has formed to denote that a range-bound trading pattern has been kept by the market.
Will the UST/USD market feature in a range-bound more for some time?
There is the possibility that the UST/USD market may feature more for some time underneath the 14-day SMA trend line. The range-bound trading zones could cover points up to $0.40 as apparently shown by the smaller SMA trading indicator. Contrary to that assumption analytics, the price will have to make a sharp sudden push to the downside of the current ranging spot to find support to swing back upward into a bullish direction afterward.
On the downside of the technical analysis, the UST/USD market short-position takers have to stay focused looking out for an active reversal-moving mode of price around the $0.40 resistance level before considering a sell order execution. It is well technically ideal to take note of the positioning reactions of the Stochastic Oscillators to compliment the next signal that has to follow in the subsequent sessions.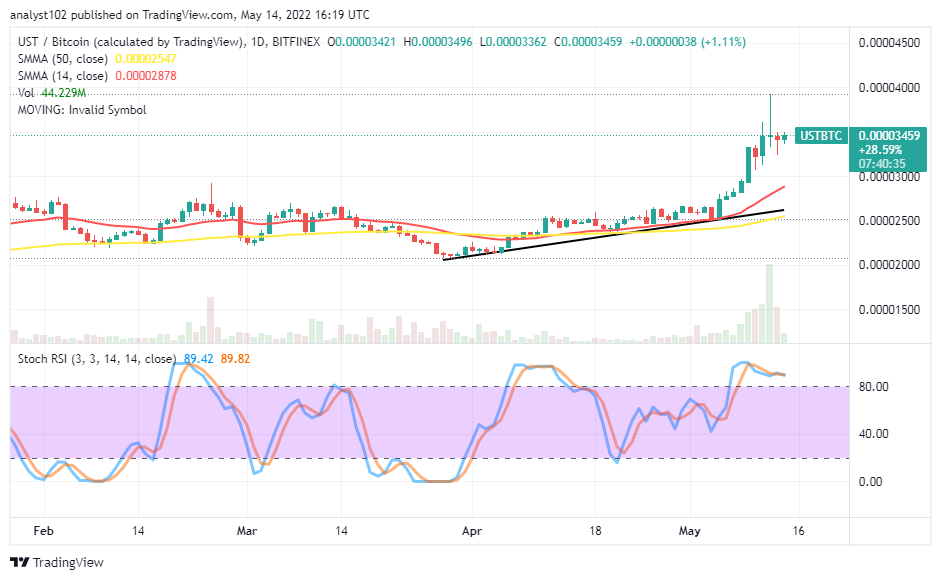
UST/BTC Price Analysis
In comparison, UST has run into a bullish-trading outlook against Bitcoin over several sessions until the present. The base trading instrument has shut upward to hit a higher resistance line about three days back, pairing with the countering instrument in the field of crypto-economy trading. The 14-day SMA has bent northward above the 50-day SMA indicator. And they are beneath the current trading spot. The Stochastic Oscillators are in the overbought region, moving in a consolidation manner to denote the flagship countering crypto is yet to push against its base crypto.
Looking to buy or trade TerraUSD now? Invest at eToro!
68% of retail investor accounts lose money when trading CFDs with this provider.
Read more:


