The Binance coin price prediction shows that BNB may climb above the 21-day moving average to begin the upward trend.
Binance coin Prediction Statistics Data:
- Binance coin price now – $236.2
- Binance coin market cap – $38.6 billion
- Binance coin circulating supply – 163.2 billion
- Binance coin total supply – 163.2 billion
- Binance coin Coinmarketcap ranking – #5
BNB/USD Market
Key Levels:
Resistance levels: $300, $320, $340
Support levels: $170, $150, $130
BNB/USD is hovering at around $236.2 as the coin prepares for the upside. Today’s trading begins with a slight bullish movement in the market as the coin moves to cross above the 21-day moving average. However, traders are anticipating that the current price movement is an indication of the upcoming price rally in the market.
Binance Coin Price Prediction: Binance Coin Gets Ready for The Upside
According to the daily chart, the next step for the Binance Coin price is to cross above the 21-day moving average. Once this is done, bulls may now push the coin towards the upper boundary of the channel to hit the resistance levels at $300, $320, and $340 respectively.
However, as the technical Indicator Relative Strength Index (14) moves above the 40-level, BNB/USD may cross to the north, once this plays out, it can manage to sustain the bullish movement towards the resistance levels of $250 and $270. Meanwhile, if the price decides to make a quick turn to the south, the support levels could be found at $170, $150, and $130 respectively.
Against Bitcoin, the Binance coin crosses above the 9-day and 21-day moving averages as the coin trades near the upper boundary of the channel. At the moment, bulls are pushing the coin to the positive side as the technical Indicator Relative Strength Index (14) remains above 60-level.
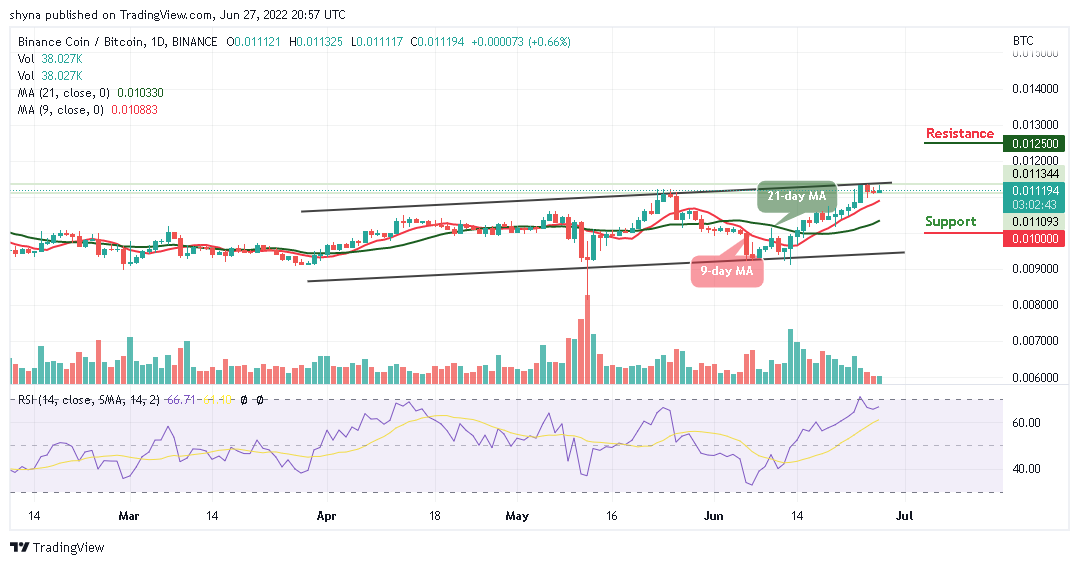
However, if the bears drag the price below the moving averages, BNB/BTC may fall to the support level of 1000 SAT and below. Meanwhile, the continuation of the bullish movement may push the coin above the channel, and staying there may cause the coin to hit the resistance level of 1250 SAT and above.
Our Recommended Crypto Exchange for U.S. customers
- 120+ Cryptos Wallet Available
- Paypal available
- Licensed and regulated in the U.S.
- Social trading Platform & copy trading
- Low trading fees
Read more:


