Weak bullish movement in ATOM market
ATOMUSD Price Analysis – September 23
ATOM may break up the resistance level of $14 provided the bulls increase their pressure; above it are $16 and $18 resistance levels. Should the $14 resistance level holds, the price may decrease to the support level at $13, further increase in the bears’ pressure may push down the price to $8 level.
ATOM/USD Market
Key levels:
Resistance levels: $14, $16, $18
Support levels: $13, $10, $8
ATOMUSD Long-term Trend: Bullish
ATOMUSD is bullish on the daily chart. The crypto bounces from the low of $5 on June 18 when the bear’ momentum failed. Buyers take over the market and price soars to the high of $13 with strong bullish momentum. The bulls gain more pressure and it breaks up the resistance level of $13. It increases and tested $16 level on September 09.
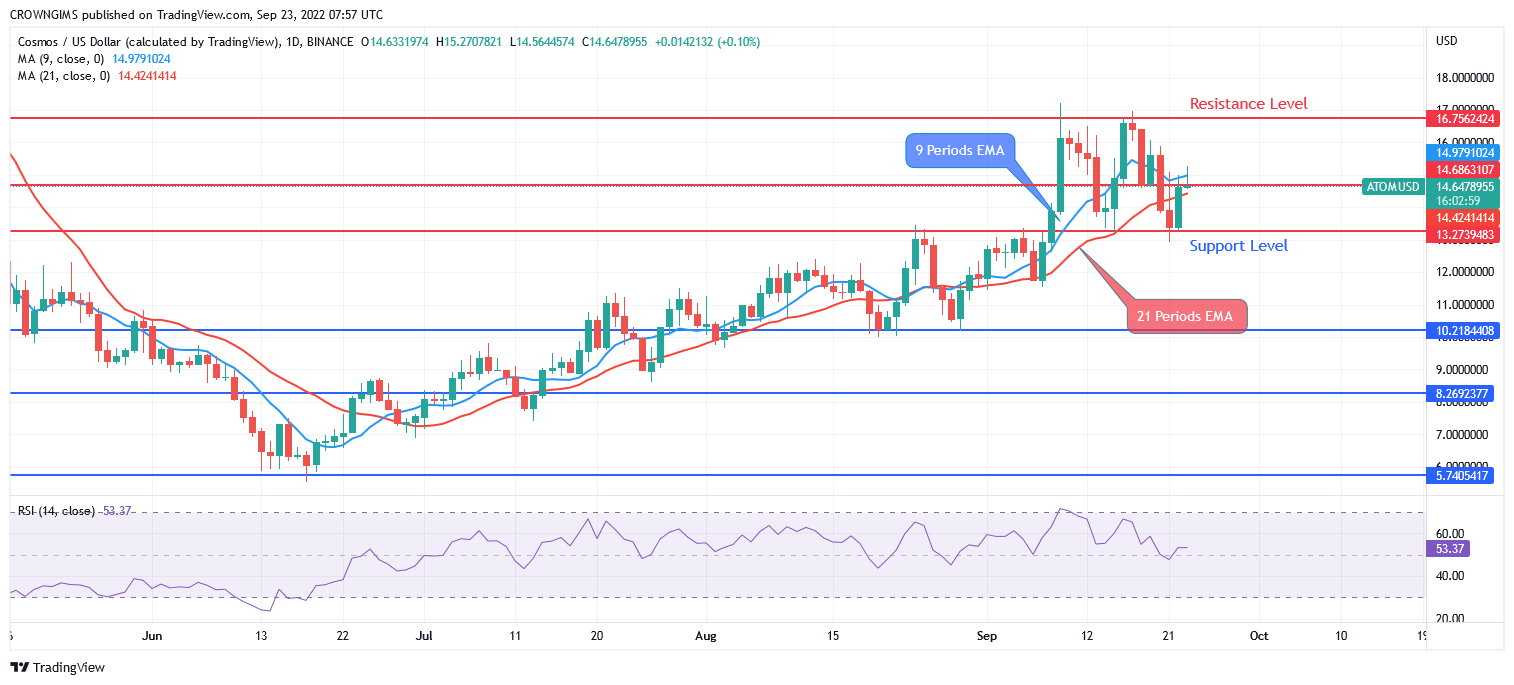
The price is trading above the two EMAs as a sign of bullish movement but the fast Moving Average (9 periods) and the slow Moving Average (21 periods EMA) are separated. Cosmos may break up the resistance level of $14 provided the bulls increase their pressure; above it are $16 and $18 resistance levels. Should the $14 resistance level holds, the price may decrease to the support level at $13, further increase in the bears’ pressure may push down the price to $8 level.
ATOMUSD medium-term Trend: Bullish, Tamadoge Goes Stronger
ATOMUSD is bullish in the 4-hour chart. The price could not decrease further when the bears lost their momentum at $5 level. Buyers’ pressure pushed the price to the high of $16. The just mentioned level holds and there is no enough momentum from the sellers to push down the price. This scenario led to the ranging movement within $16 and $14 levels.
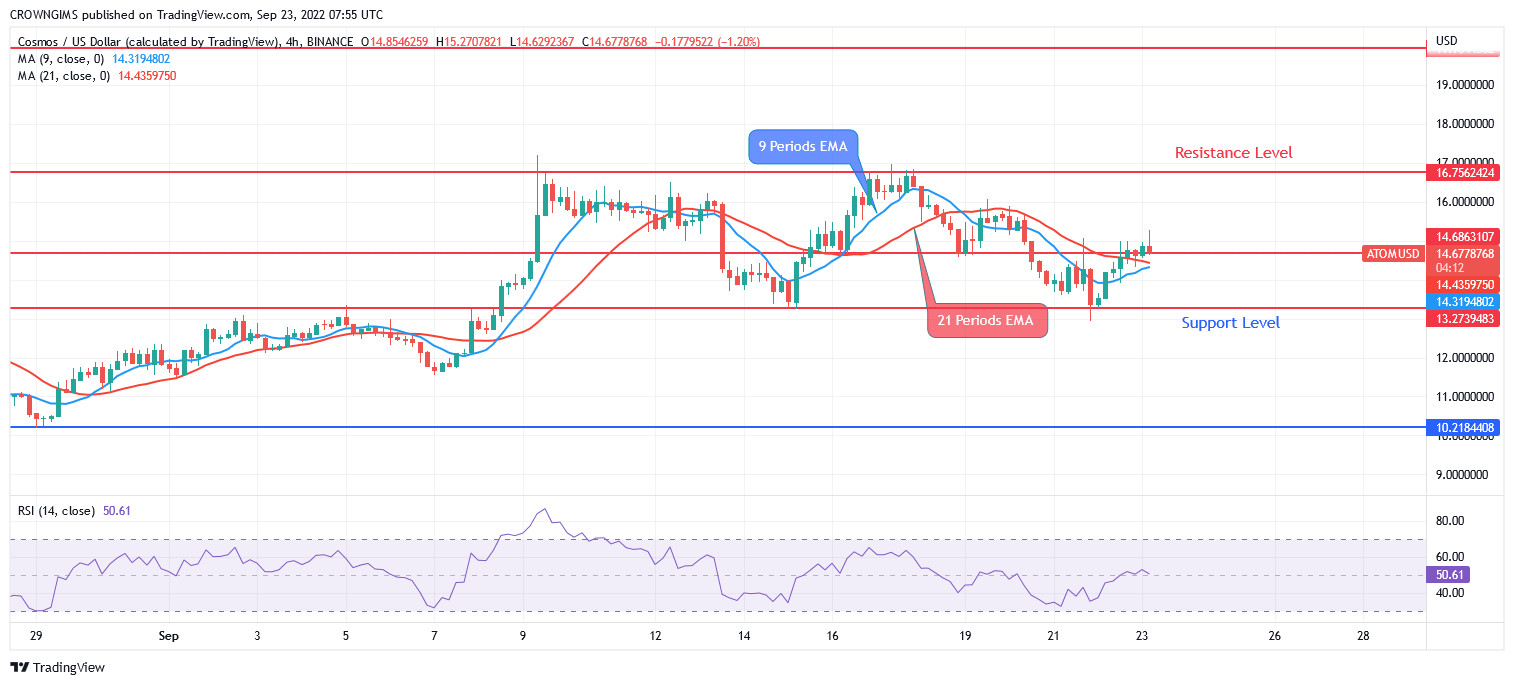
The two EMAs are close to each other and the currency pair is trading around the 21 periods EMA and 9 periods EMA which indicates that ranging movement is in progress. The relative strength index period 14 is at 46 levels and the signal lines pointing down to indicate sell signal.


