Cardano (ADA) is struggling to start a fresh increase above the $0.500 resistance zone. ADA must stay above the $0.480 support to start a decent upward move.
- ADA price is struggling to gain bullish momentum above the $0.50 zone.
- The price is trading above $0.480 and the 100-hourly simple moving average.
- There is a key bullish trend line forming with support near $0.480 on the hourly chart of the ADA/USD pair (data source from Kraken).
- The pair could gain bullish momentum if there is a close above $0.500.
Cardano Price Remains Supported
In the past few days, Cardano started a recovery wave from the $0.4620 zone, but lagged behind Bitcoin and Ethereum. ADA price broke the $0.4750 and $0.480 levels to move into a short-term bullish zone.
The price even spiked above $0.50 but it failed to continue higher. A high was formed at $0.510 and recently there was a downside correction. The price declined below the $0.4980 support. It dipped below the 23.6% Fib retracement level of the upward move from the $0.4614 swing low to the $0.510 low.
Cardano is now trading above $0.480 and the 100-hourly simple moving average. There is also a key bullish trend line forming with support near $0.480 on the hourly chart of the ADA/USD pair. The trend line is close to the 61.8% Fib retracement level of the upward move from the $0.4614 swing low to the $0.510 low.
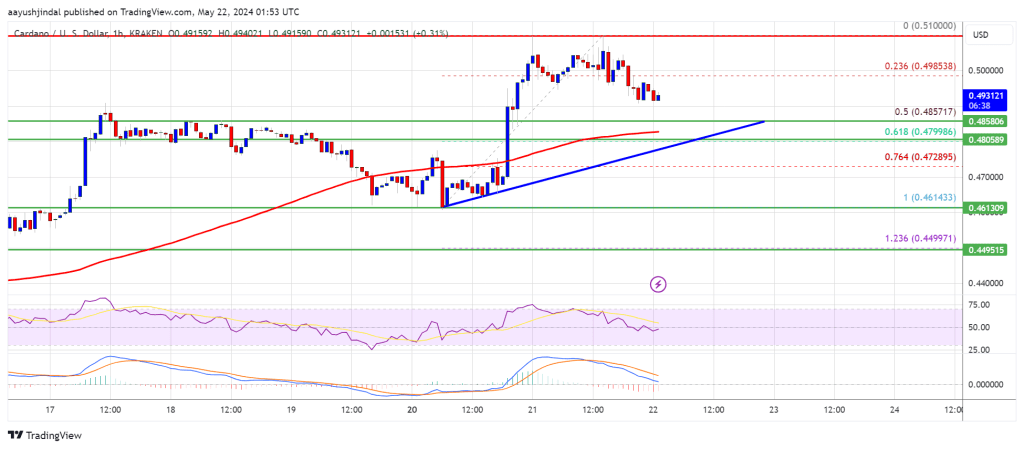
On the upside, immediate resistance is near the $0.4980 zone. The first resistance is near $0.510. The next key resistance might be $0.5250. If there is a close above the $0.5250 resistance, the price could start a strong rally. In the stated case, the price could rise toward the $0.5450 region. Any more gains might call for a move toward $0.5650.
Another Decline in ADA?
If Cardano’s price fails to climb above the $0.4980 resistance level, it could start another decline. Immediate support on the downside is near the $0.450 level.
The next major support is near the $0.480 level. A downside break below the $0.480 level could open the doors for a test of $0.4620. The next major support is near the $0.450 level.
Technical Indicators
Hourly MACD – The MACD for ADA/USD is gaining momentum in the bearish zone.
Hourly RSI (Relative Strength Index) – The RSI for ADA/USD is now below the 50 level.
Major Support Levels – $0.4850, $0.4800, and $0.4620.
Major Resistance Levels – $0.4980, $0.5100, and $0.5250.


