Bitcoin is once again at the center of market turbulence, trading just above the $110,000 level, which many analysts view as a critical zone of demand. While BTC is holding this support for now, volatility has surged as bears increase pressure and investor sentiment grows cautious. The market is closely watching whether Bitcoin can maintain its footing or if a deeper correction will unfold.
One of the biggest factors fueling this uncertainty is the recent capital rotation from Bitcoin to Ethereum, a shift that has rattled Bitcoin loyalists. Ethereum’s resilience and whale accumulation have put BTC under additional scrutiny, raising fears that Bitcoin’s dominance in the market could weaken if the trend continues.
Adding to the caution, top analyst Axel Adler highlighted fresh data showing a surge in BTC+ETH inflows to exchanges following Bitcoin’s all-time high of $124,000. At the same time, stablecoin inflows lagged significantly, signaling that the recent increase in supply on exchanges was not met with fresh liquidity. This imbalance often points to profit-taking and excess selling pressure.
Bitcoin Inflow Ratio Signals Bearish Setup
According to Adler, the recent weakness in Bitcoin is strongly linked to exchange flow dynamics. He points to the Inflow Ratio (BTC+ETH ÷ Stablecoins), a key indicator that measures the balance between major crypto inflows and stablecoin liquidity. Recently, this ratio spiked to 4.0×, coinciding with a wave of selling pressure and a noticeable price pullback. Adler explains this as a classic case of excess supply overwhelming fresh liquidity, a dynamic that has historically placed downward pressure on Bitcoin.
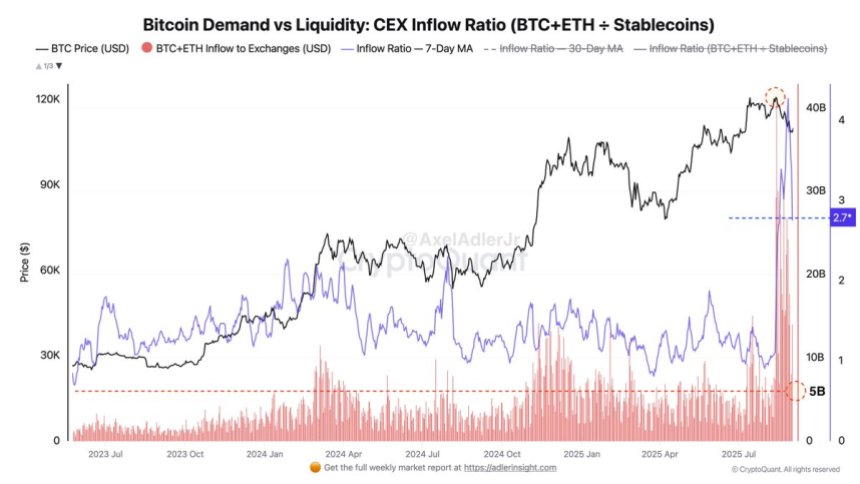
Since then, the ratio has eased to around 2.7× on a 7-day moving average, and inflow volumes of majors have cooled to approximately $5 billion per day. While this marks an improvement from the extremes, it still signals that inflows of BTC and ETH are relatively high compared to the stablecoin capital available to absorb them. Simply put, there is not enough new demand flowing in to support sustained upward movement at current levels.
Adler’s assessment suggests that Bitcoin remains in a bearish setup, with limited buying liquidity keeping rallies capped. However, he also cautions that crypto markets are highly dynamic, and trends can shift quickly. A sudden resurgence in stablecoin inflows or renewed institutional demand could reverse the current imbalance, sparking another bullish leg. For now, though, the data leans bearish, highlighting the importance of monitoring exchange flows as BTC navigates this critical phase.
BTC Testing Pivotal Resistance Level
Bitcoin is currently trading near $111,192, showing a modest recovery after last week’s volatility that pushed the price below $108,000. The chart highlights Bitcoin’s attempt to reclaim momentum, with the price hovering just above the 100-day SMA (green line at ~$111,737). This moving average now acts as immediate resistance, and BTC needs a clear breakout above it to signal strength.
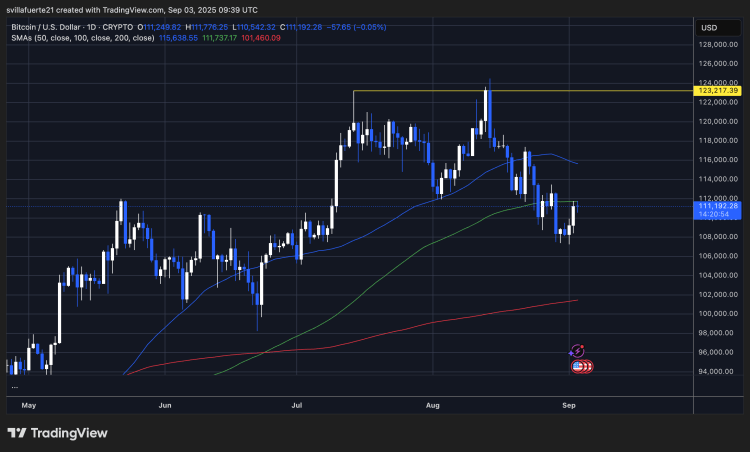
On the upside, the 50-day SMA (~$115,638) represents the next major barrier. If bulls manage to push above this level, it would open the path to retesting the local peak around $123,217, marked as a key resistance line. However, Bitcoin’s inability to sustain gains above the 100-day SMA in recent sessions suggests that sellers remain active.
Support lies around $108,000, with stronger demand likely at the 200-day SMA (~$101,460). A breakdown below $108,000 could expose BTC to deeper losses, potentially dragging the price toward the psychological $100,000 level.
Bitcoin remains in a consolidation zone, caught between major moving averages. A decisive move above $115,000 would tilt momentum bullish again, while a failure to hold current levels risks renewed selling pressure. Bulls must defend $108,000 to prevent further downside.
Featured image from Dall-E, chart from TradingView


