Bitcoin current position at the $64,515 support level has sparked significant interest among traders and analysts. This key threshold is seen as a critical juncture that could dictate the cryptocurrency’s near-term trajectory. On the one hand, bullish proponents argue that robust fundamentals and renewed investor interest could propel Bitcoin higher. On the other hand, bearish sentiment driven by macroeconomic pressures and regulatory uncertainties suggests a potential crash.
With a market capitalization of more than $1.2 trillion and a trading volume of more than $34 billion as of the time of writing, the price of Bitcoin is up by 0.04%, trading at around $65,621 in the last 24 hours. BTC market cap and trading volume are currently down by 0.66%% and 6.05% respectively.
Technical Analysis: Bitcoin Chart Patterns And Indicators
This analysis delves into weighing the bullish and bearish scenarios in other to determine Bitcoin’s future price actions. Bitcoin’s price on the 4-hour chart is currently making a retracement after a rejection at the $64,515 support level and it’s still trading below the 100-day Simple Moving Average (SMA). Although it seems like the price is moving toward the $66,736 level, this may only be a short-term move as it may drop down again.
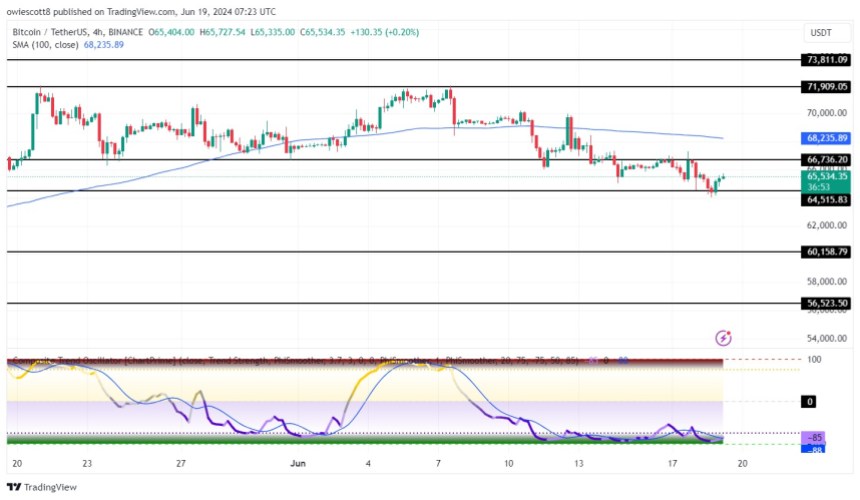
Also, it can be observed that both the signal line and SMA of the Composite Trend Oscillator indicator are still struggling in the oversold section suggesting further future decline in the price of BTC.
From the 1-day chart, BTC’s price, having successfully dropped below the 100-day SMA with strong bearish momentum, is making a short-term pullback. After this pullback, the flagship crypto may begin to drop again toward the $64,515 support level.
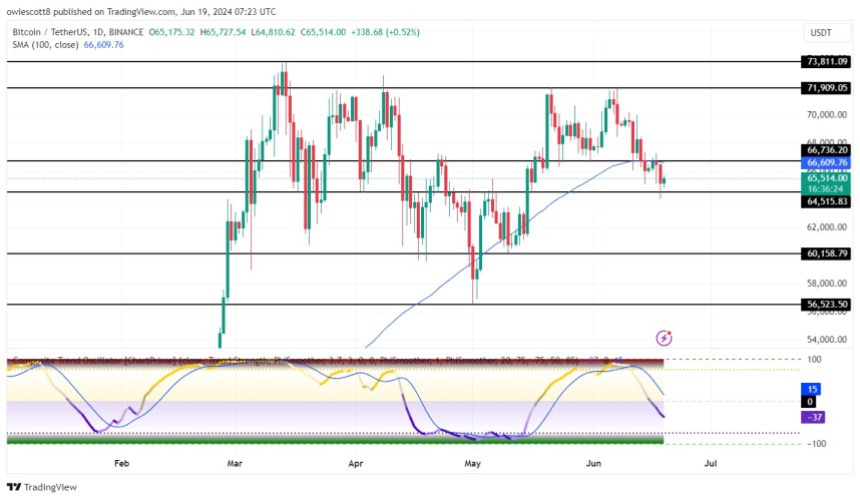
Furthermore, it can be observed here that both the signal line and SMA of the 1-day Composite Trend Oscillator are attempting to drop below the zero line. With this current formation, it can be suggested that BTC’s price may go bearish in the long run.
Weighing The Bullish And Bearish Cases
Currently, there are four key support levels and three key resistance levels to look out for in the images used in this article. If the price of Bitcoin continues bearish as predicted, it will start to move downward toward the $64,515 support level to retest it. In the event of a break below this level, BTC will decline further to test the $60,158 level and possibly other support levels.
However, given that the digital asset fails to go bearish and decides to go bullish, it will begin to move toward the $66,607 resistance level. It could move even higher to challenge the $71,909 resistance level if it breaks above the aforementioned level and possibly moves on to test its new high.


