Bitcoin has been struggling over the past few days, losing momentum after recently setting a new all-time high above $124,000. The price has since dropped below the $115,000 level, bringing volatility back into the market. For many analysts, this zone represents a decisive moment for Bitcoin’s trajectory: it could either spark a fast continuation toward higher levels or evolve into a prolonged consolidation phase that tests investor patience.
Some market watchers believe that the decline is a natural cooling phase after months of relentless gains, while others see risks of deeper downside if support fails to hold. However, top analyst Darkfost has pointed to a potentially bullish signal emerging on derivatives markets. According to his data, the Binance Taker Buy-Sell Ratio has dropped to cycle lows.
Historically, sharp declines in this ratio have often signaled contrarian opportunities, where excessive bearish positioning eventually fueled strong rebounds. With Bitcoin hovering near critical support, the coming days will reveal whether this indicator aligns with a renewed surge or if further consolidation lies ahead.
Binance Taker Buy-Sell Ratio Flashes Contrarian Signal
According to top analyst Darkfost, the taker buy-sell ratio is one of the most effective indicators to measure sentiment in the derivatives market. This ratio evaluates the balance between aggressive buying (taker buy orders) and aggressive selling (taker sell orders). When the ratio is above 1, it reflects a dominance of buy orders, typically signaling bullish sentiment and strong market confidence. Conversely, when the ratio falls below 1, sell orders outweigh buys, indicating bearish sentiment and increased selling pressure.

Currently, the ratio has dropped to 0.95 on Binance, marking its lowest level observed in this cycle. At face value, this would suggest that bearish sentiment dominates the order book, often associated with price weakness and potential downward phases. However, Darkfost emphasizes that markets often behave in a contrarian fashion—moving against the majority’s expectations.
Historically, sharp declines in this ratio have often preceded strong rebounds, as bearish positioning becomes excessive and creates fuel for short squeezes or renewed buying. Each time the ratio has reached such depressed levels, it has acted as a buying opportunity, setting the stage for significant upward moves.
In the current context, with Bitcoin trading near key support after its recent pullback, this contrarian signal could mark the beginning of another strong leg upward if buyers step in decisively.
Bitcoin Tests Key Support After Sharp Pullback
Bitcoin is showing renewed weakness on the daily chart after failing to sustain momentum above its all-time high near $124,500. The chart highlights a steep pullback, with BTC now trading at $113,467, testing a crucial support area just above the 100-day moving average (MA) at $111,140.
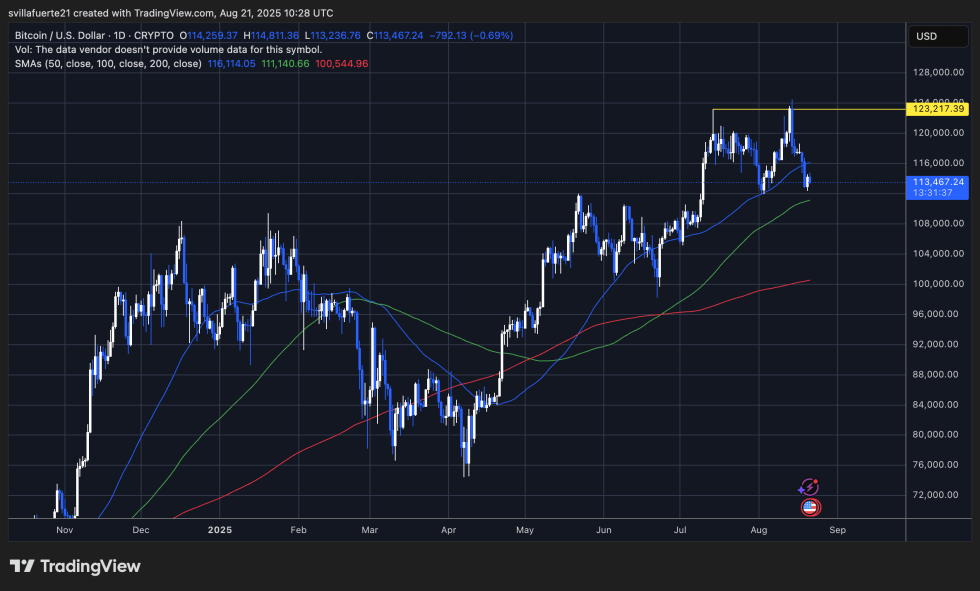
The chart highlights how momentum has shifted since BTC failed to sustain above $123,217, a marked resistance level from earlier in the month. Sellers quickly stepped in, creating a sequence of lower highs and pushing the price toward its moving average cluster. The 50-day SMA ($116,114) has also flipped into resistance, suggesting near-term bearish control.
Related Reading: Bitcoin Apparent Demand Weakens: Expansion Slows To 30K BTC
For bulls, the immediate task is to defend the $113K–$111K range. Holding above this area could provide the base for a rebound attempt, especially if macro sentiment or on-chain accumulation strengthens. Conversely, failure to hold here risks accelerating downside pressure.
In the short term, Bitcoin remains in a consolidation phase within a broader uptrend, but the next few sessions will be critical in deciding whether price stabilizes for another rally attempt or slips into a deeper correction.
Featured image from Dall-E, chart from TradingView


