On-chain data suggests a Bitcoin indicator is currently mirroring the same trend that led to the top of the bull run in 2021.
Bitcoin Long-Term Holder Distribution Appears To Be Ending
As explained by CryptoQuant community manager Maartunn in a post on X, the BTC long-term holders are currently showcasing a trend that’s reminiscent of 2021.
The “long-term holders” (LTHs) are Bitcoin investors who have been keeping their coins dormant (that is, not transferring or selling them from their wallet) for more than 155 days.
Generally, the longer a holder keeps their coins still, the less likely they are to move them at any point. As such, the LTHs, with their long holding times, are considered the market’s resolute hands.
These investors usually don’t react to events in the wider market, like a rally or crash, but this year’s price surge towards the new all-time high (ATH) has forced even these HODLers into selling.
The chart below shows the trend in the total Bitcoin supply held by the addresses belonging to the LTH cohort over the last few years:
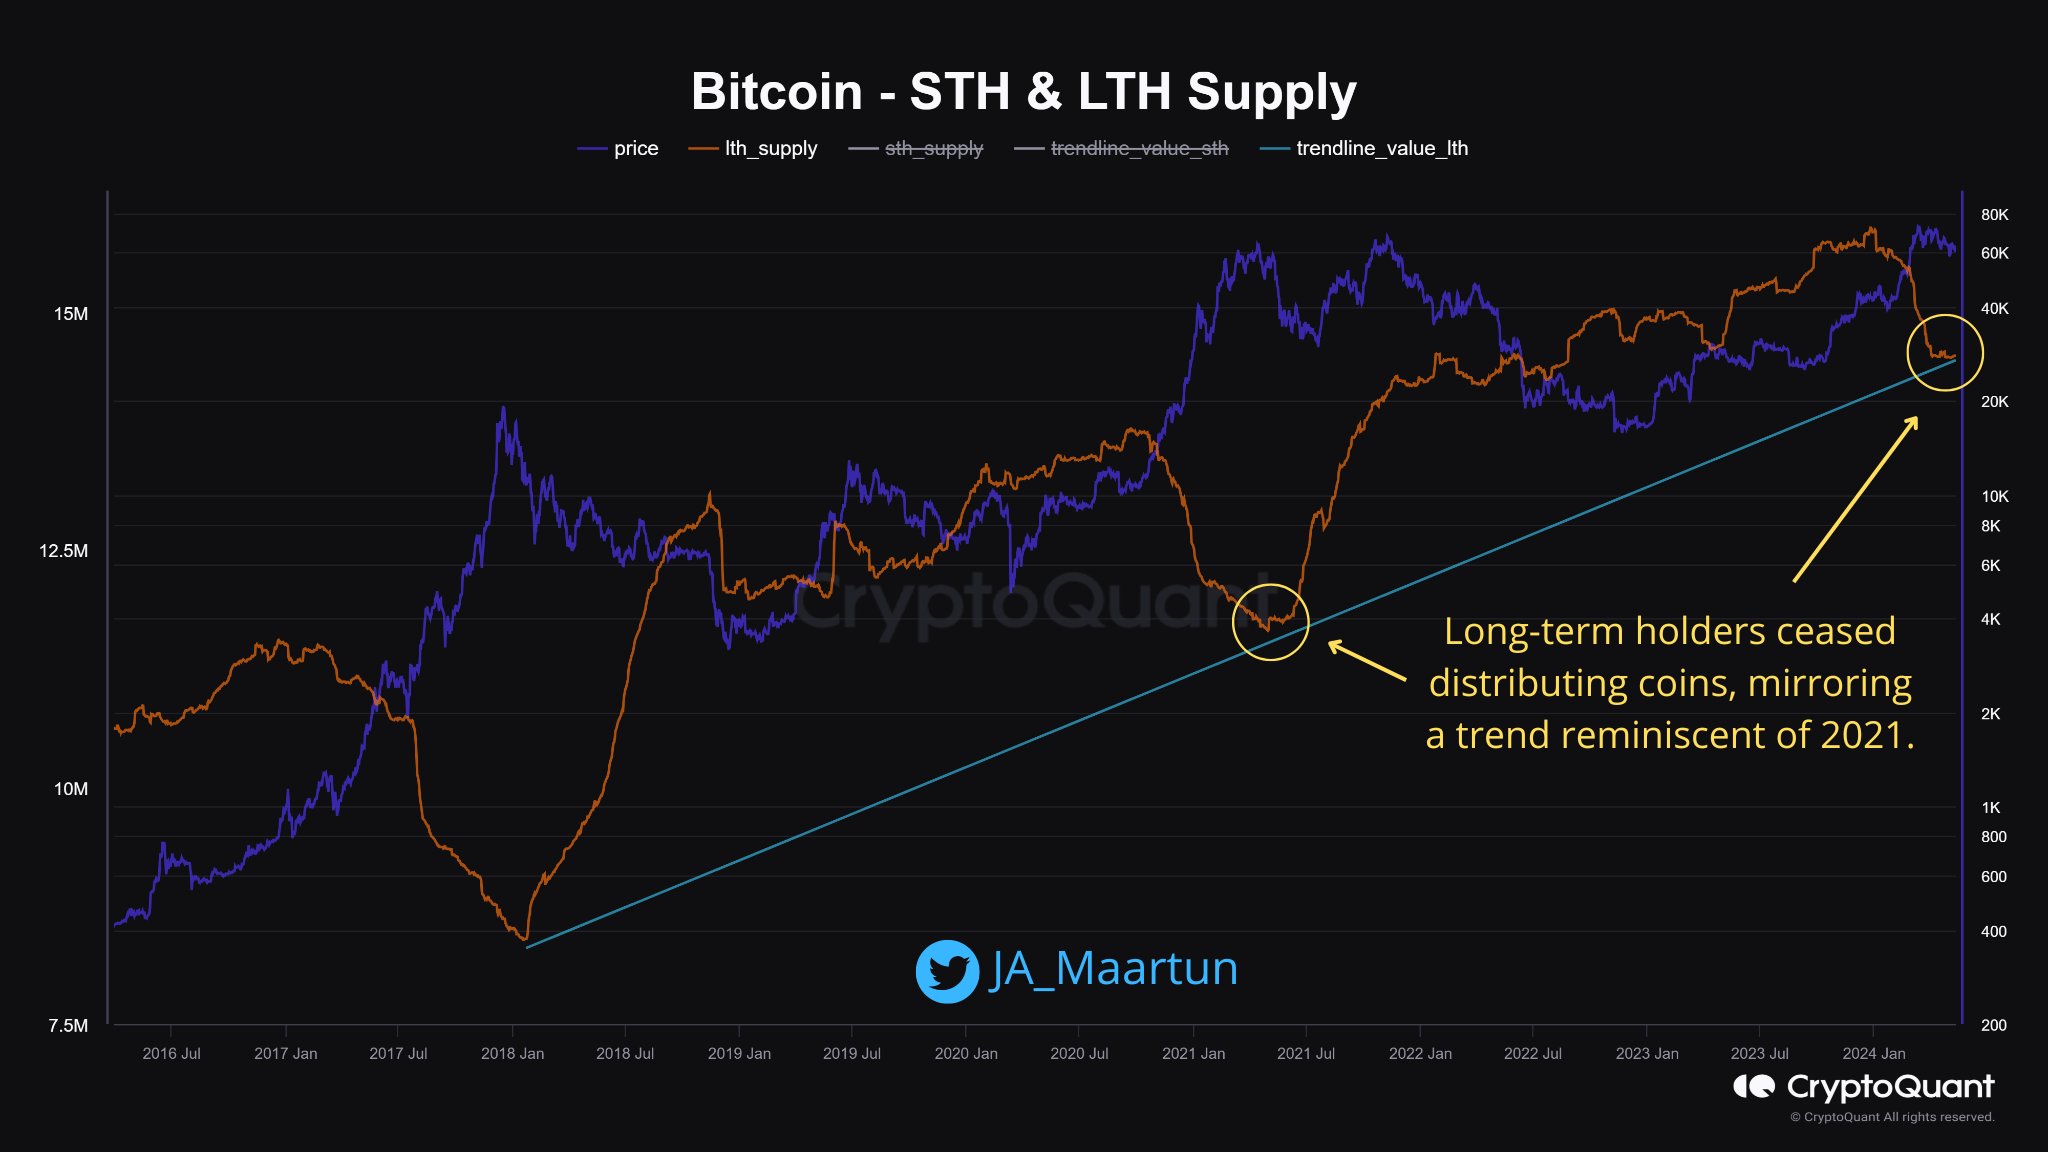
As the graph shows, Bitcoin LTHs were accumulating between the May 2021 crash and this year’s rally. With this rise towards the new ATH, though, the supply of these HOLDers has started observing a downtrend instead.
Something to keep in mind is that the indicator has a 155-day delay when it comes to buying, as only mature supplies can count under it.
Thus, when the metric goes up, it doesn’t mean that there is accumulation in the present but rather that some buying occurred 155 days ago, and these coins have just now aged enough to count under the LTHs.
For selling, though, no such delay is attached, as coins exit the group as soon as they are transferred on the network. As such, the latest decline would correspond to a selloff that has been happening in the present.
Recently, as the Bitcoin price has fallen prey to stagnation, the LTHs have slowed down their selling, with the supply more or less moving sideways. As Maartunn has highlighted in the chart, this trend is similar to what was observed in 2021.
The LTHs ending their distribution then meant a top for the cryptocurrency. A similar pattern was also witnessed during the 2017 bull run. Therefore, going by these historical precedents, the latest flat movement in the LTH supply could also suggest a potential peak for the latest bull run.
This is only if, of course, the LTH distribution has truly ended. The chart shows that in each of the last two bull markets, the initial sharp selling from the LTHs was followed up by a phase of slower-paced distribution.
This slowed-down decline continued for months before the metric reached the consolidation phase and the asset’s top occurred. It now remains to be seen if the latest trend shift in the Bitcoin LTH supply corresponds to the former or the latter phase.
BTC Price
At the time of writing, Bitcoin is floating around the $62,700 level, down almost 2% over the past week.


