Bitcoin Price Prediction – January 11
Now, the Bitcoin price prediction shows BTC gaining around 0.37% after touching the daily high of $42,620.
BTC/USD Long-term Trend: Bearish (Daily Chart)
Key levels:
Resistance Levels: $47,000, $49,000, $51,000
Support Levels: $37,000, $35,000, $33,000
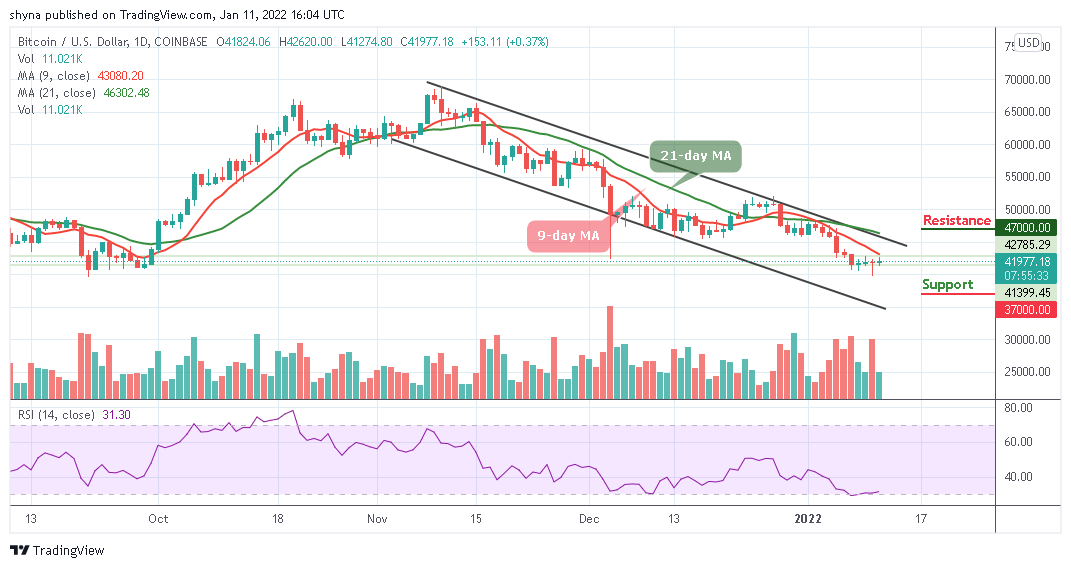
The daily chart reveals that BTC/USD couldn’t break above the previous resistance level of $42,500. Moreover, the Bitcoin (BTC) begins the day off by trending lower toward the $41,200 level inside the channel. However, if the coin slides the support level of $41,000, it may likely hit the critical supports at $37,000, $35,000, and $33,000.
Bitcoin Price Prediction: Bitcoin (BTC) May Consolidate below the Moving Averages
The Bitcoin price fails to stay above the resistance level of $42,000 as it looks to set up another few days of negative price below the $41,000. Meanwhile, a break above the opening price of $41,824 may need to set the king coin to reach the nearest resistance level of $44,000. But now, traders can note that the Bitcoin price fails to cross above the 9-day moving shows that the coin may move sideways.
At the time of writing, the Bitcoin price is yet to go higher as it is seen range-bounding below the 9-day and 21-daymoving averages. However, should the technical indicator move back below into the oversold, the market price may remain within the negative side but on the contrary, moving towards the upside could see the resistance levels at $47,000, $49,000, and $51,000.
BTC/USD Medium-Term Trend: Bearish (4H Chart)
According to the 4-hour chart, the bulls are seen coming back into the market as the coin crosses above the 9-day and 21-day moving averages. On the contrary, if the Bitcoin price decide to follow the bearish movement, it is likely for it to reach the support at $40,000 and below.
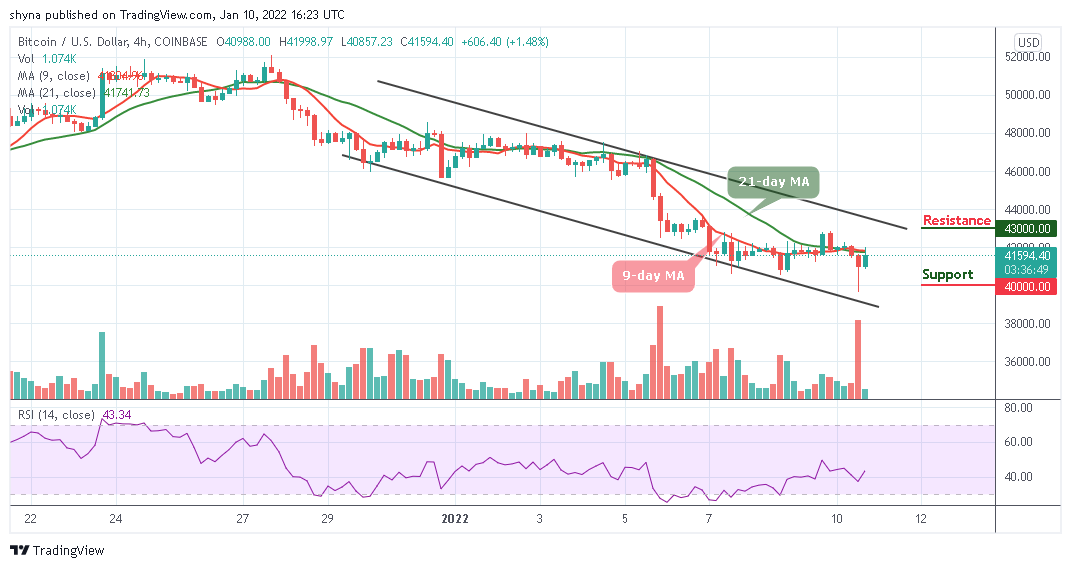
However, if the buyers continue with the current movement and push it more upward, traders may expect the coin to hit the nearest resistance level at $43,000; breaking above this level could further allow the bulls to hit the resistance level of $44,000 and above. Now, the Relative Strength Index (14) signal line is seen moving towards 60-level to confirm the current bullish movement.
Looking to buy or trade Bitcoin (BTC) now? Invest at eToro!
68% of retail investor accounts lose money when trading CFDs with this provider
Read more:


