Bitcoin is up 10% since last Sunday, reclaiming key levels and setting the tone for what could be the next major leg in this bull cycle. After briefly dipping below $100,000 amid geopolitical tensions in the Middle East, BTC has rebounded strongly and is now trading above $106,000 — a level that signals renewed strength and market confidence. However, despite the breakout from recent lows, the rally still needs confirmation. Analysts agree that the bullish structure will only be fully validated once Bitcoin breaks above its all-time high and enters price discovery.
Momentum is clearly shifting in favor of the bulls. Trading volumes are climbing, and investor sentiment is turning optimistic as BTC approaches the $110K resistance. Yet, not all indicators are aligned. According to CryptoQuant, the MVRV Ratio — which measures market value relative to realized value — is beginning to stall. Historically, this has preceded slower phases of growth or local tops.
While a decisive breakout could trigger the next surge, the current hesitation in on-chain momentum suggests traders should remain alert. With volatility rising and macro uncertainty still present, BTC’s next move could define the broader market trend heading into the second half of the year.
Bitcoin At A Crossroads: Will Bulls Break Out or Retrace?
Bitcoin is hovering at a pivotal level, with the market on edge as it decides between a breakout into price discovery or a deeper retrace toward lower support. After rebounding 10% since last Sunday, BTC reclaimed the $106K level, recovering from recent volatility caused by geopolitical tensions. Bulls are confidently holding the range, yet momentum has stalled just below the crucial $110K mark — the gateway to new all-time highs. Meanwhile, bears have failed to push Bitcoin below the psychological $100K level, signaling strong underlying demand.
According to on-chain data from CryptoQuant, while the short-term recovery looks impressive, the MVRV Ratio is flashing early warning signs. This metric — which compares Bitcoin’s market value to its realized value — helps identify overvaluation zones. More importantly, the 365-day moving average slope of the MVRV Ratio, which has reliably signaled cycle tops in the past, is starting to flatten. This suggests that bullish momentum could be fading, even as prices hold up.
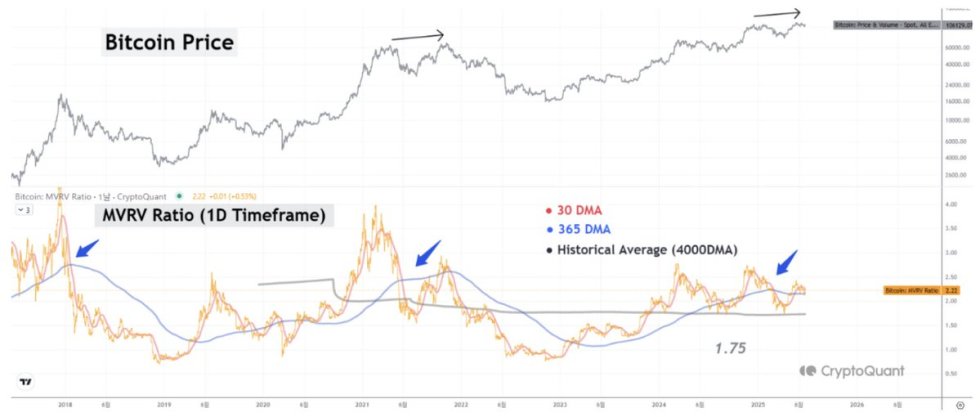
This development doesn’t imply that a downtrend is imminent, but it does raise the possibility that Bitcoin is entering the late stages of this bull cycle. Historically, such phases often culminate in euphoric surges before topping out. With that in mind, traders and investors must remain strategic. Managing risk and capital allocation becomes critical when momentum weakens, especially in a high-stakes environment.
While there’s still room for short-term upside — especially if BTC breaks above $110K — long-term signals advise caution. Tactical plays may be profitable, but ignoring macro and on-chain context at this stage could expose portfolios to unnecessary risk.
BTC Faces Local Resistance
Bitcoin is currently trading at $107,227, showing strong recovery momentum after last week’s dip to $98,000. The 12-hour chart reveals a bullish structure, with price breaking above the 50 and 100-period SMAs, both converging around $105,500 — now acting as near-term support. The move confirms bullish intent, especially as volume picked up significantly on the breakout from the $103,600 support zone.
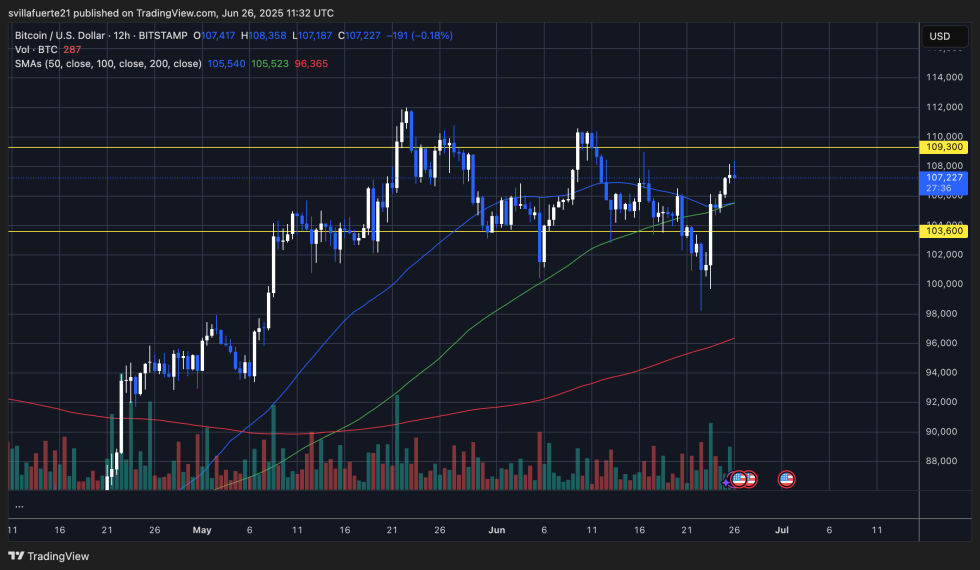
However, BTC is now approaching a critical resistance level at $109,300, which has acted as a ceiling for over a month. Price action suggests multiple failed attempts to break this level, forming what many traders would call a local “horizontal range.” A clean break and close above $109,300 would likely trigger a push into price discovery, with bulls targeting $115,000 and beyond.
On the downside, a rejection at current levels could lead to a retest of the $105,000 support. The 200-period SMA around $96,365 remains the ultimate support base in case of a deeper correction.
Featured image from Dall-E, chart from TradingView


