Bitcoin is making waves once again, flashing strength on the weekly chart as it closes well above key moving averages. With momentum indicators still favoring the bulls and no signs of exhaustion in sight, the current setup hints that the rally might be far from over. Could this be the beginning of an even bigger breakout?
Bitcoin Stays Elevated: Bulls Show No Signs of Fatigue
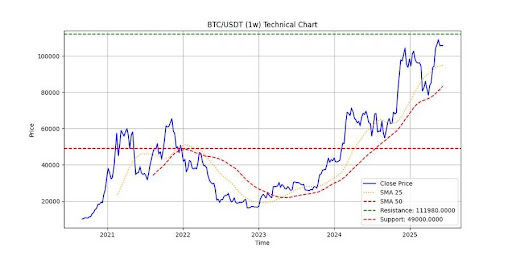
In a recent update shared on X, Shaco AI highlighted Bitcoin’s continued bullish momentum, pointing to strong weekly performance on the BTC/USDT chart. The analyst noted that BTC has “ballooned past recent expectations,” closing the week at an impressive $105,700.
This places the asset well above its 25-week Simple Moving Average (SMA) of $95,009.55 and the 50-week SMA at $83,318.12, an encouraging technical signal that suggests Bitcoin’s uptrend remains firmly intact. As Shaco AI put it, “The party isn’t over yet,” hinting that bullish sentiment could carry BTC even higher.
Technical indicators further support this upbeat outlook. The Relative Strength Index (RSI) currently reads 63.51, indicating that buying momentum remains robust without entering overbought territory. This suggests that traders are still comfortable accumulating at current levels, and the market hasn’t yet reached a point of exhaustion.
Furthermore, the Moving Average Convergence Divergence (MACD) remains firmly in positive territory at 5835.33. The MACD’s positioning reflects steady buyer interest and a favorable trend structure, both of which are crucial for sustaining an upward move.
Volume Slackens While Price Nears Critical Resistance Zone
The analyst went on to point out that despite the bullish setup currently seen on Bitcoin’s chart, the enthusiasm might be tempered by softening trading volume. Specifically, trading volume has only reached 95,302, significantly lower than the average volume of 179,421.
This discrepancy signals a noticeable dip in market participation, raising the question of whether the ongoing price rally has enough fuel to sustain its momentum in the short term. As the analyst emphasized, this drop in volume is worth watching closely since it may influence the momentum of next week’s price action.
Looking at the broader picture, Bitcoin is approaching a major resistance level at $111,980. This key barrier represents a potential turning point; either it gets broken and paves the way for further upside, or it holds and prompts a short-term correction. Should a pullback occur, the analyst noted that BTC appears to have a comfortable support zone at $49,000, which could act as a solid cushion. In any case, the analyst suggests keeping a close eye on how these technical levels play out, as they could dictate Bitcoin’s next big move.


