The post Chainlink Price is Breaking Out a Massive Pattern— Could Initiate a 500% Jump in 2025, If Validated appeared first on Coinpedia Fintech News
Chainlink price is breaking out! The price is heading towards the yearly highs at $22.89 with an aim to set up a bullish path towards the ATH. The price recorded one of the most bullish monthly closes, with a rise of over 80%, not seen since the 2021 bull run. The price printed massive bullish candles then, and hence a similar pattern suggests the LINK price is at the foothill of a massive explosion, which may elevate the levels beyond a 3-digit figure.
The catalyst of the rise is the recent partnership announcement of Chainlink with 21X, Europe’s first tokenised securities trading and settlement system, to launch the very first EU-regulated financial market infrastructure. With this, the LINK price broke the resistance at $19.25 with a major force, shooting past $20 in the past few hours. All eyes are now on $22.90, which is around the yearly highs, and a breakout from this range may propel the price towards a new ATH.
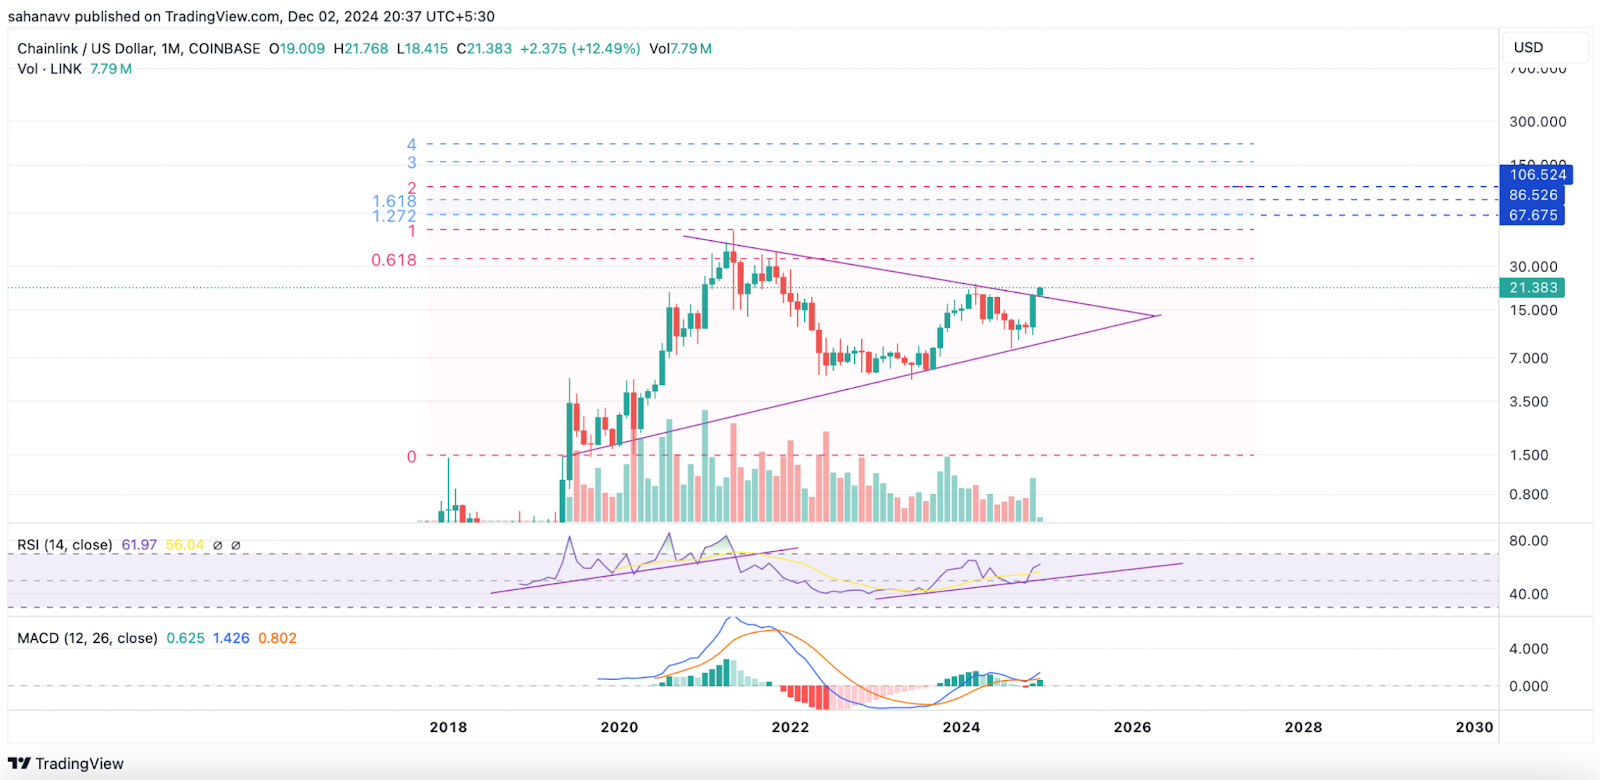
The monthly chart of Chianlink displays a breakout from the multi-year symmetrical triangle before reaching the apex. This suggests strong bullish momentum being piled up since the past month as the buying volume revamped after largely being under bearish influence since the start of the year. The immediate upper target could be around $34.2 at 0.618 FIB, which could pay way for the price to reach the ATH at 1 FIB at $52.88.
Meanwhile, the technicals have tuned in favour of the bulls as the RSI has just launched an incremental range along the ascending support as it appeared during the 2021 bull run. On the other hand, the MACD, which was about to undergo a bearish crossover, has reversed as the buying pressure escalates. Therefore, there are clear signals of a bullish continuation with the upper targets as mentioned in the chart, provided the yearly close is above the pattern.
Chainlink is largely considered to be undervalued despite being the integral part of not only DeFi but traditional finance, insurance, real estate, gaming, etc., and many more. However, the integration into other financial entities, including DTCC, and now with 21X, highlights the project’s potential. Hence, the LINK price is expected to perform well in the coming days with and unlock higher targets, firstly above $100.


