Crypto analyst Egrag has once again shared a bullish analysis of Hedera Hashgraph (HBAR), predicting a potential 30x increase (2,900%). His latest chart analysis (HBAR/USD) presents a view where HBAR stands in the current market cycle, highlighting key Fibonacci retracement levels and critical price points that could guide HBAR’s movement in the months ahead.
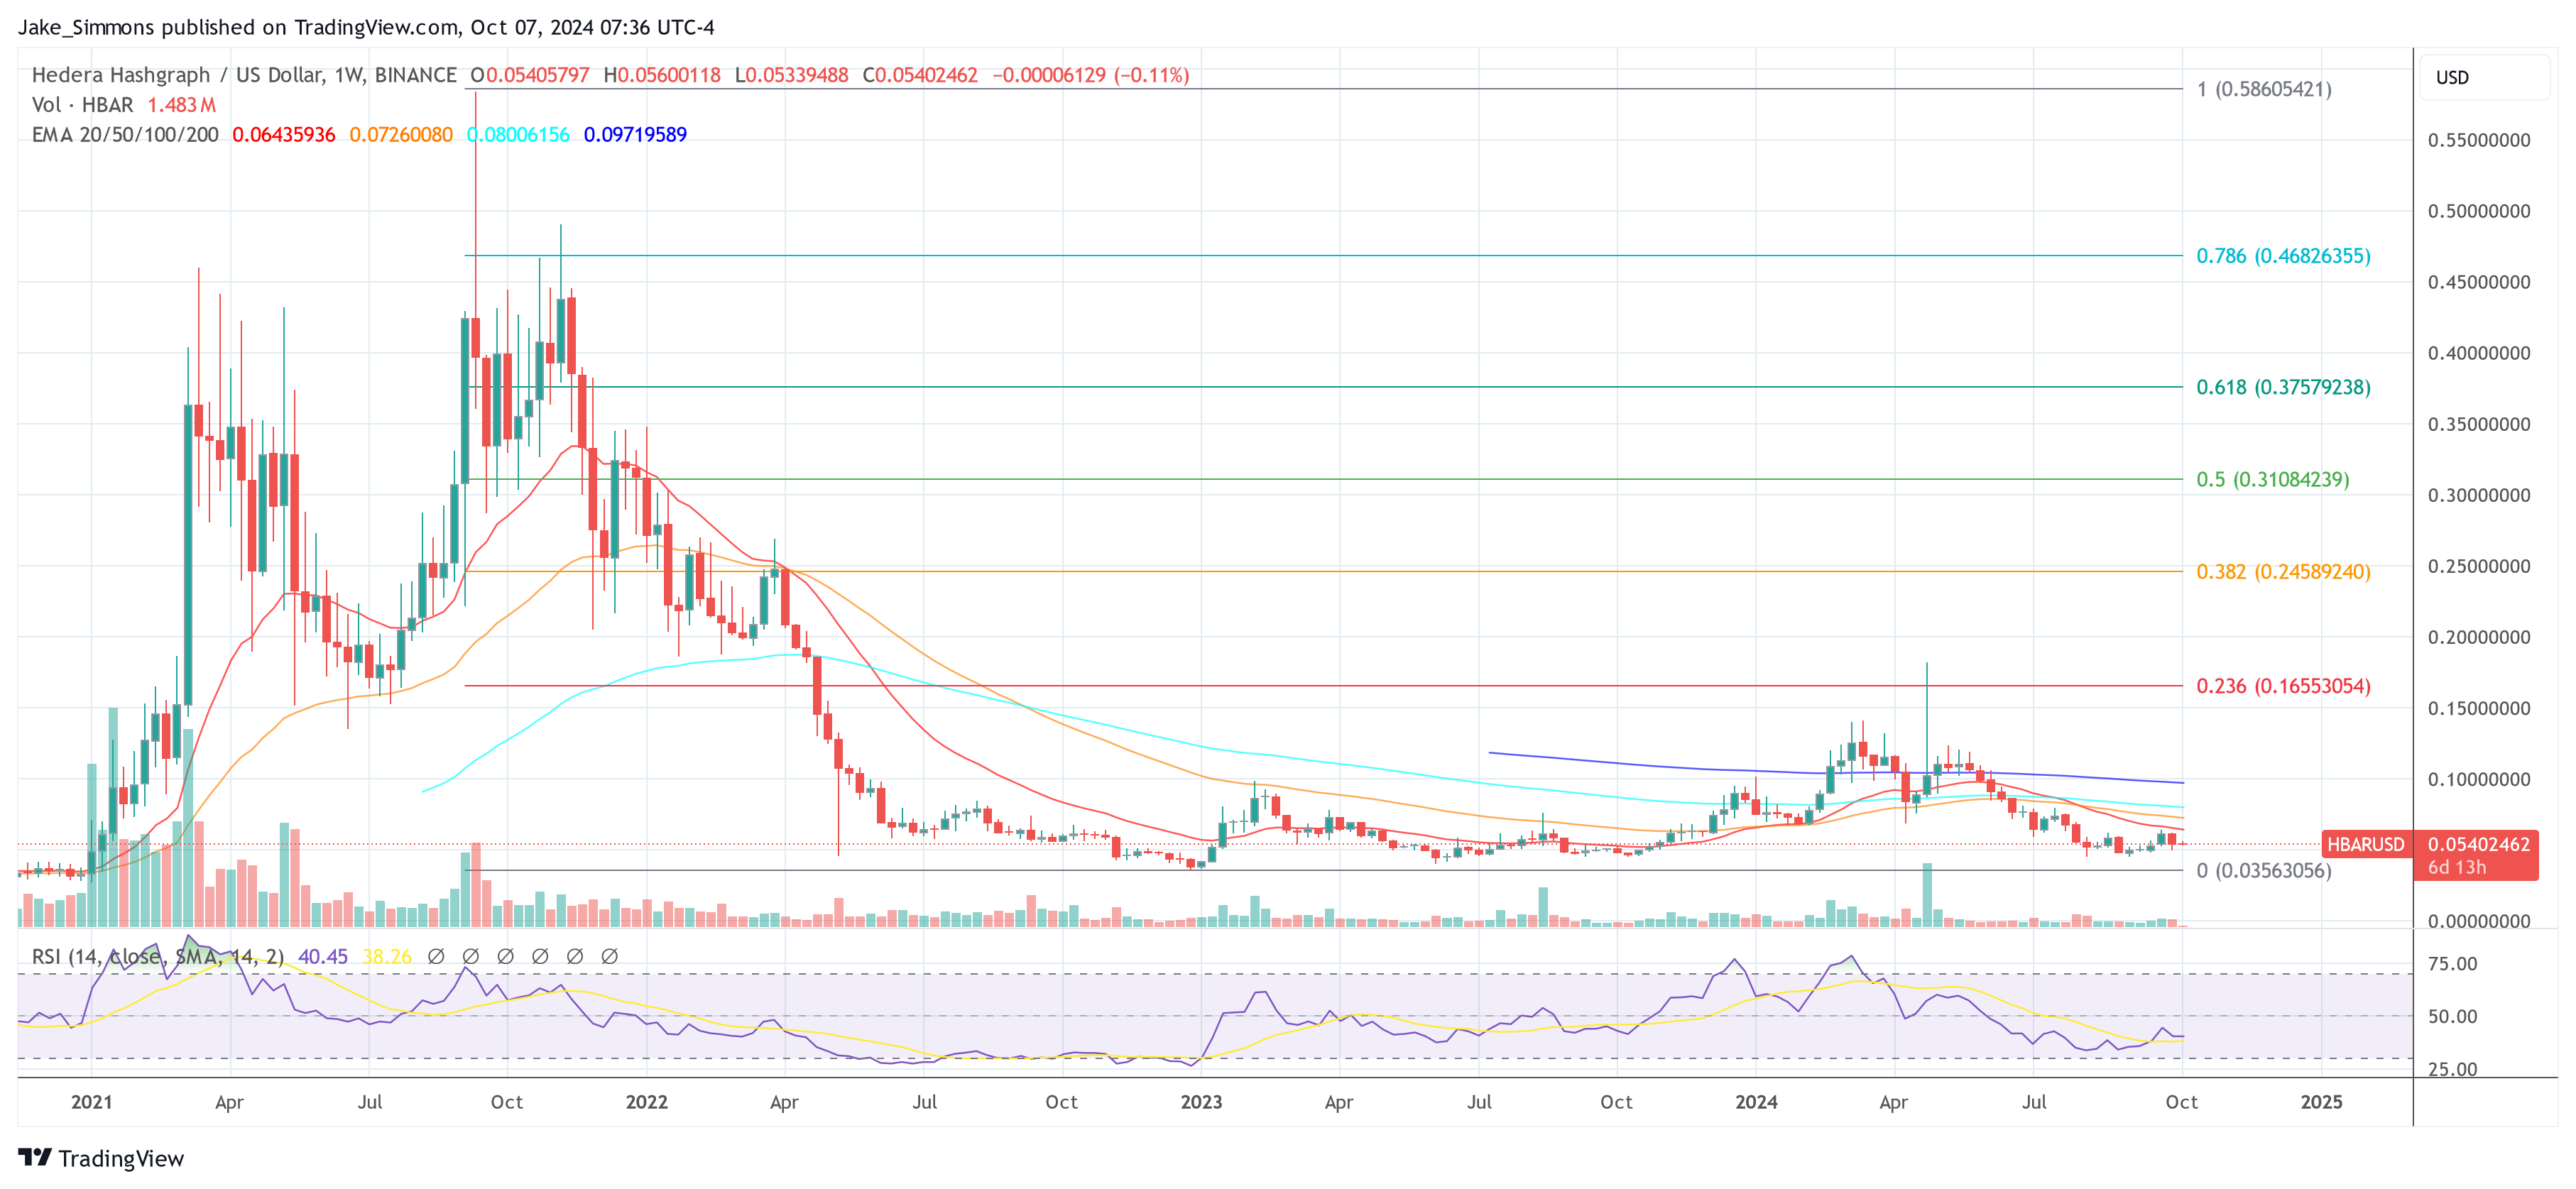
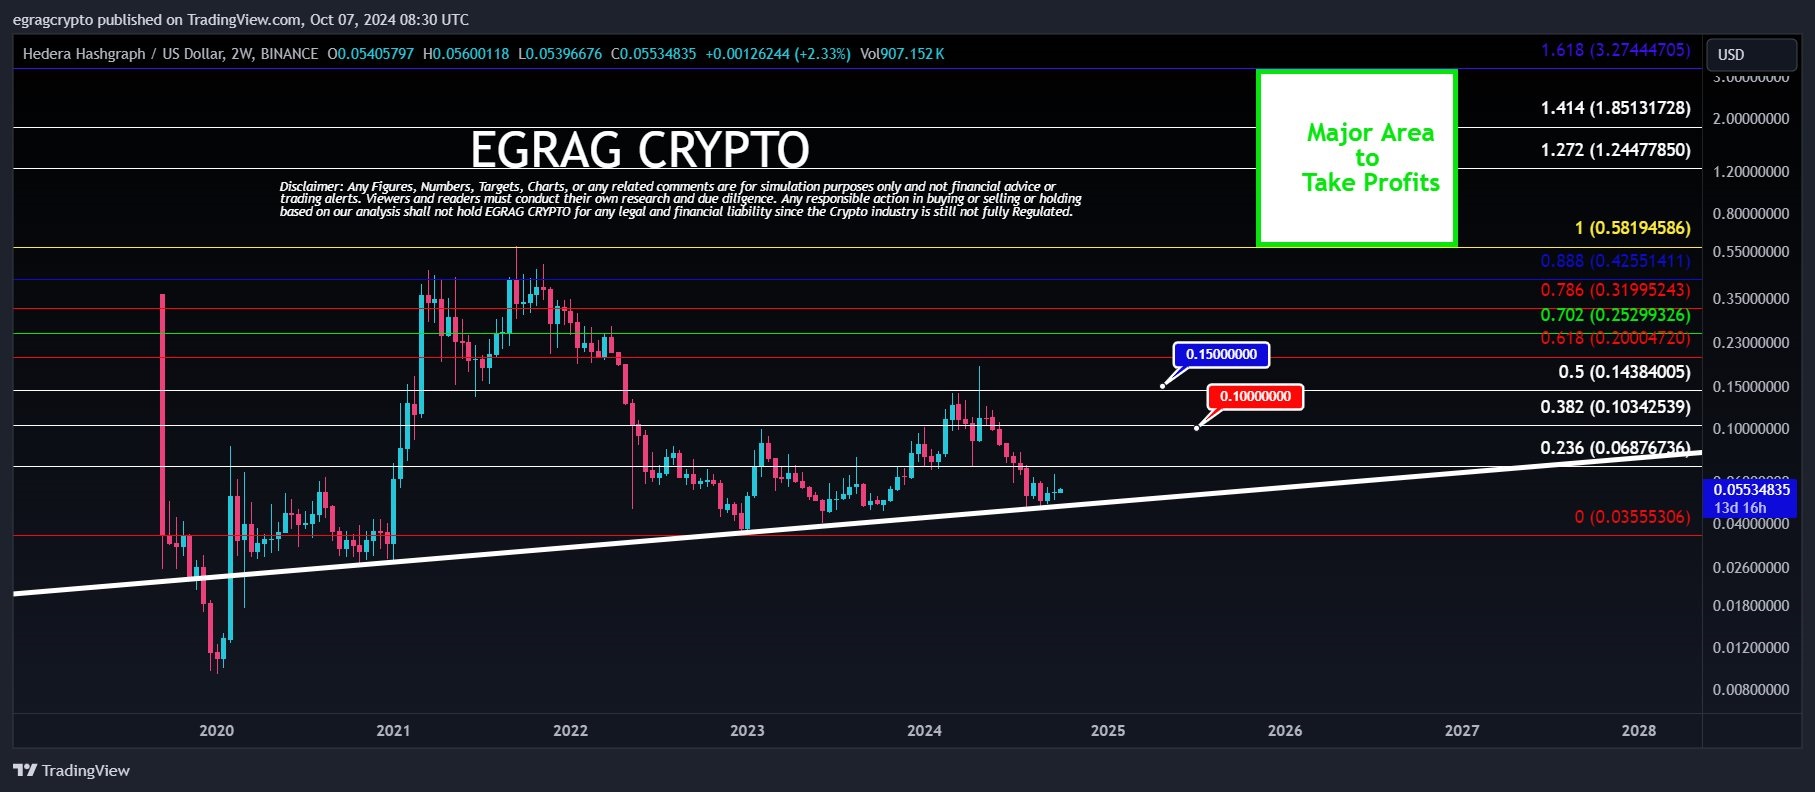
At the time of Egrag’s analysis, HBAR is trading at approximately $0.0553, with a recent low marked around $0.0355. This price action in the 2-week chart is taking place along a key upward trendline that has acted as strong support multiple times since 2020. This trendline, which stretches over multiple years, has held HBAR’s price during dips and corrections, except for one instance in December 2019.
Egrag also pinpoints several Fibonacci retracement levels, a popular tool used in technical analysis to identify potential support and resistance levels. These levels are derived from the Fibonacci sequence, where each level corresponds to a percentage of the price movement between a significant high and low.
In Egrag’s analysis, the chart showcases a range of Fibonacci levels, from Fib 0 at the absolute low of $0.0355 to Fib 1.618 at $3.27. Each of these levels indicates critical price points for HBAR as it moves through this market cycle.
And according to Egrag, HBAR’s fundamentals are extremely strong and a 2,900% price surge is the absolute minimum. “Last cycle, ADA skyrocketed a mind-blowing 17,000%! To put this into perspective, with HBAR’s bottom at 0.036c, a 170X move would take it to around $6! That’s why I’m all-in on HBAR! Backed by a powerhouse Governing Council, Hedera is leading the charge with cutting-edge tech for seamless tokenization, delivering top-tier performance, rock-solid security, and unmatched compliance,” Egrag notes.
Key Fibonacci Levels For Hedera (HBAR) In This Bull Run
Fib 0 – $0.03555: This is the lowest price on the chart, representing the local bottom that HBAR recently established. According to Egrag, this could be seen as the long-term support level and a significant historical low.
Fib 0.236 – $0.0687: Currently, HBAR is trading just below this Fibonacci level. It has acted as a resistance point over recent weeks, making it a crucial zone to break through for upward momentum to continue. Historically, breaking through the Fib 0.236 level often signals the start of a bullish move towards higher retracement levels.
Fib 0.382 – $0.1034: The next critical resistance level is Fib 0.382. A sustained move above this zone would indicate growing bullish momentum and a possible continuation towards even higher Fibonacci levels.
Fib 0.5 – $0.1438: The Fib 0.5 level is one of the most closely watched by traders. It represents a psychological midpoint between the asset’s high and low. According to Egrag, $0.14-$0.15 is a critical range for HBAR. “Until HBAR breaks above Fib 0.5 (0.14c-0.15c), everything else is just noise—time to accumulate for what’s coming!” Egrag claims.
Fib 0.618 – $0.2004: Known as the “Golden Ratio,” Fib 0.618 is one of the most important levels in Fibonacci analysis. A break above this level often signals the end of a retracement and the resumption of the primary trend. For HBAR, a move above $0.20 could generate significant bullish interest, paving the way for a move towards new highs.
Fib 0.702 – $0.2529: Egrag marks this level as a significant profit-taking zone. If HBAR reaches $0.25, it would represent a substantial 4.5x increase from current levels. This is a key target for traders looking to lock in profits before the next significant leg up.
Fib 0.786 – $0.3199: Fib 0.786 is often the last line of resistance before an asset retests its all-time highs. Egrag identifies this as a crucial level, where many traders may choose to sell some of their holdings.
Fib 1.0 – $0.5819: This level represents the previous all-time high (ATH) for HBAR. Breaking past $0.58 would indicate a complete recovery from the previous market cycle and set the stage for a potential new bull run. Egrag marks this as a key psychological level where his profit-taking area begins.
Fib 1.272 – $1.2447: This is one of the extended Fibonacci levels, representing a point where HBAR could see additional gains in a bullish market scenario. Egrag mentions that breaking beyond ATH could push HBAR toward this level, making it another key profit-taking zone for long-term holders.
Fib 1.414 – $1.8513: If HBAR continues its bullish momentum, it could climb towards this level, representing a major price extension. This level, according to Egrag, is where traders may choose to exit significant portions of their holdings, expecting a slowdown after a major uptrend.
Fib 1.618 – $3.27: The ultimate profit-taking zone marked on Egrag’s chart is Fib 1.618, also known as the “Golden Extension.” A move to $3.27 would represent a near 60x move from the current price and a staggering 170x increase from the local bottom of $0.03555. Egrag views this as the maximum upside potential for HBAR in this cycle.
Egrag concludes, “With its killer fundamentals and cutting-edge tech, a 30X gain is right on the horizon, making HBAR my top macro play!”
At press time, HBAR traded at $0.0504.