An analyst has explained how Dogecoin breaking the $0.087 barrier could open the path to DOGE price levels nearly double the recent ones.
Dogecoin Has Three Important Lines Converging At $0.087 Right Now
In a new post on X, analyst Ali has discussed what the weekly chart of DOGE is looking like right now in terms of some important historical lines. In particular, the levels of interest here are the 100-week EMA, 200-week EMA, and 0.786 Fibonacci.
A “moving average” (MA) refers to an analytical tool that calculates the mean of any given quantity over a specific period of time, and as its name implies, it moves in time and changes its value as the quantity fluctuates.
This basic tool is quite useful as it smooths out the curve by removing local fluctuations, making a study of long-term trends easier to perform. In the context of the current topic, though, a normal MA isn’t of focus, but rather a modified form called the exponential moving average (EMA).
The EMA works like the usual MA, except it places a greater weight on the most recent readings of the quantity. What this means is that the older the reading, the less weightage it has in the metric, so the line’s changes reflect the latest price direction more strongly.
Now, here is a chart that shows the trend in the 100-week and 200-week EMAs for Dogecoin, as well as the weekly price curve of the meme coin:
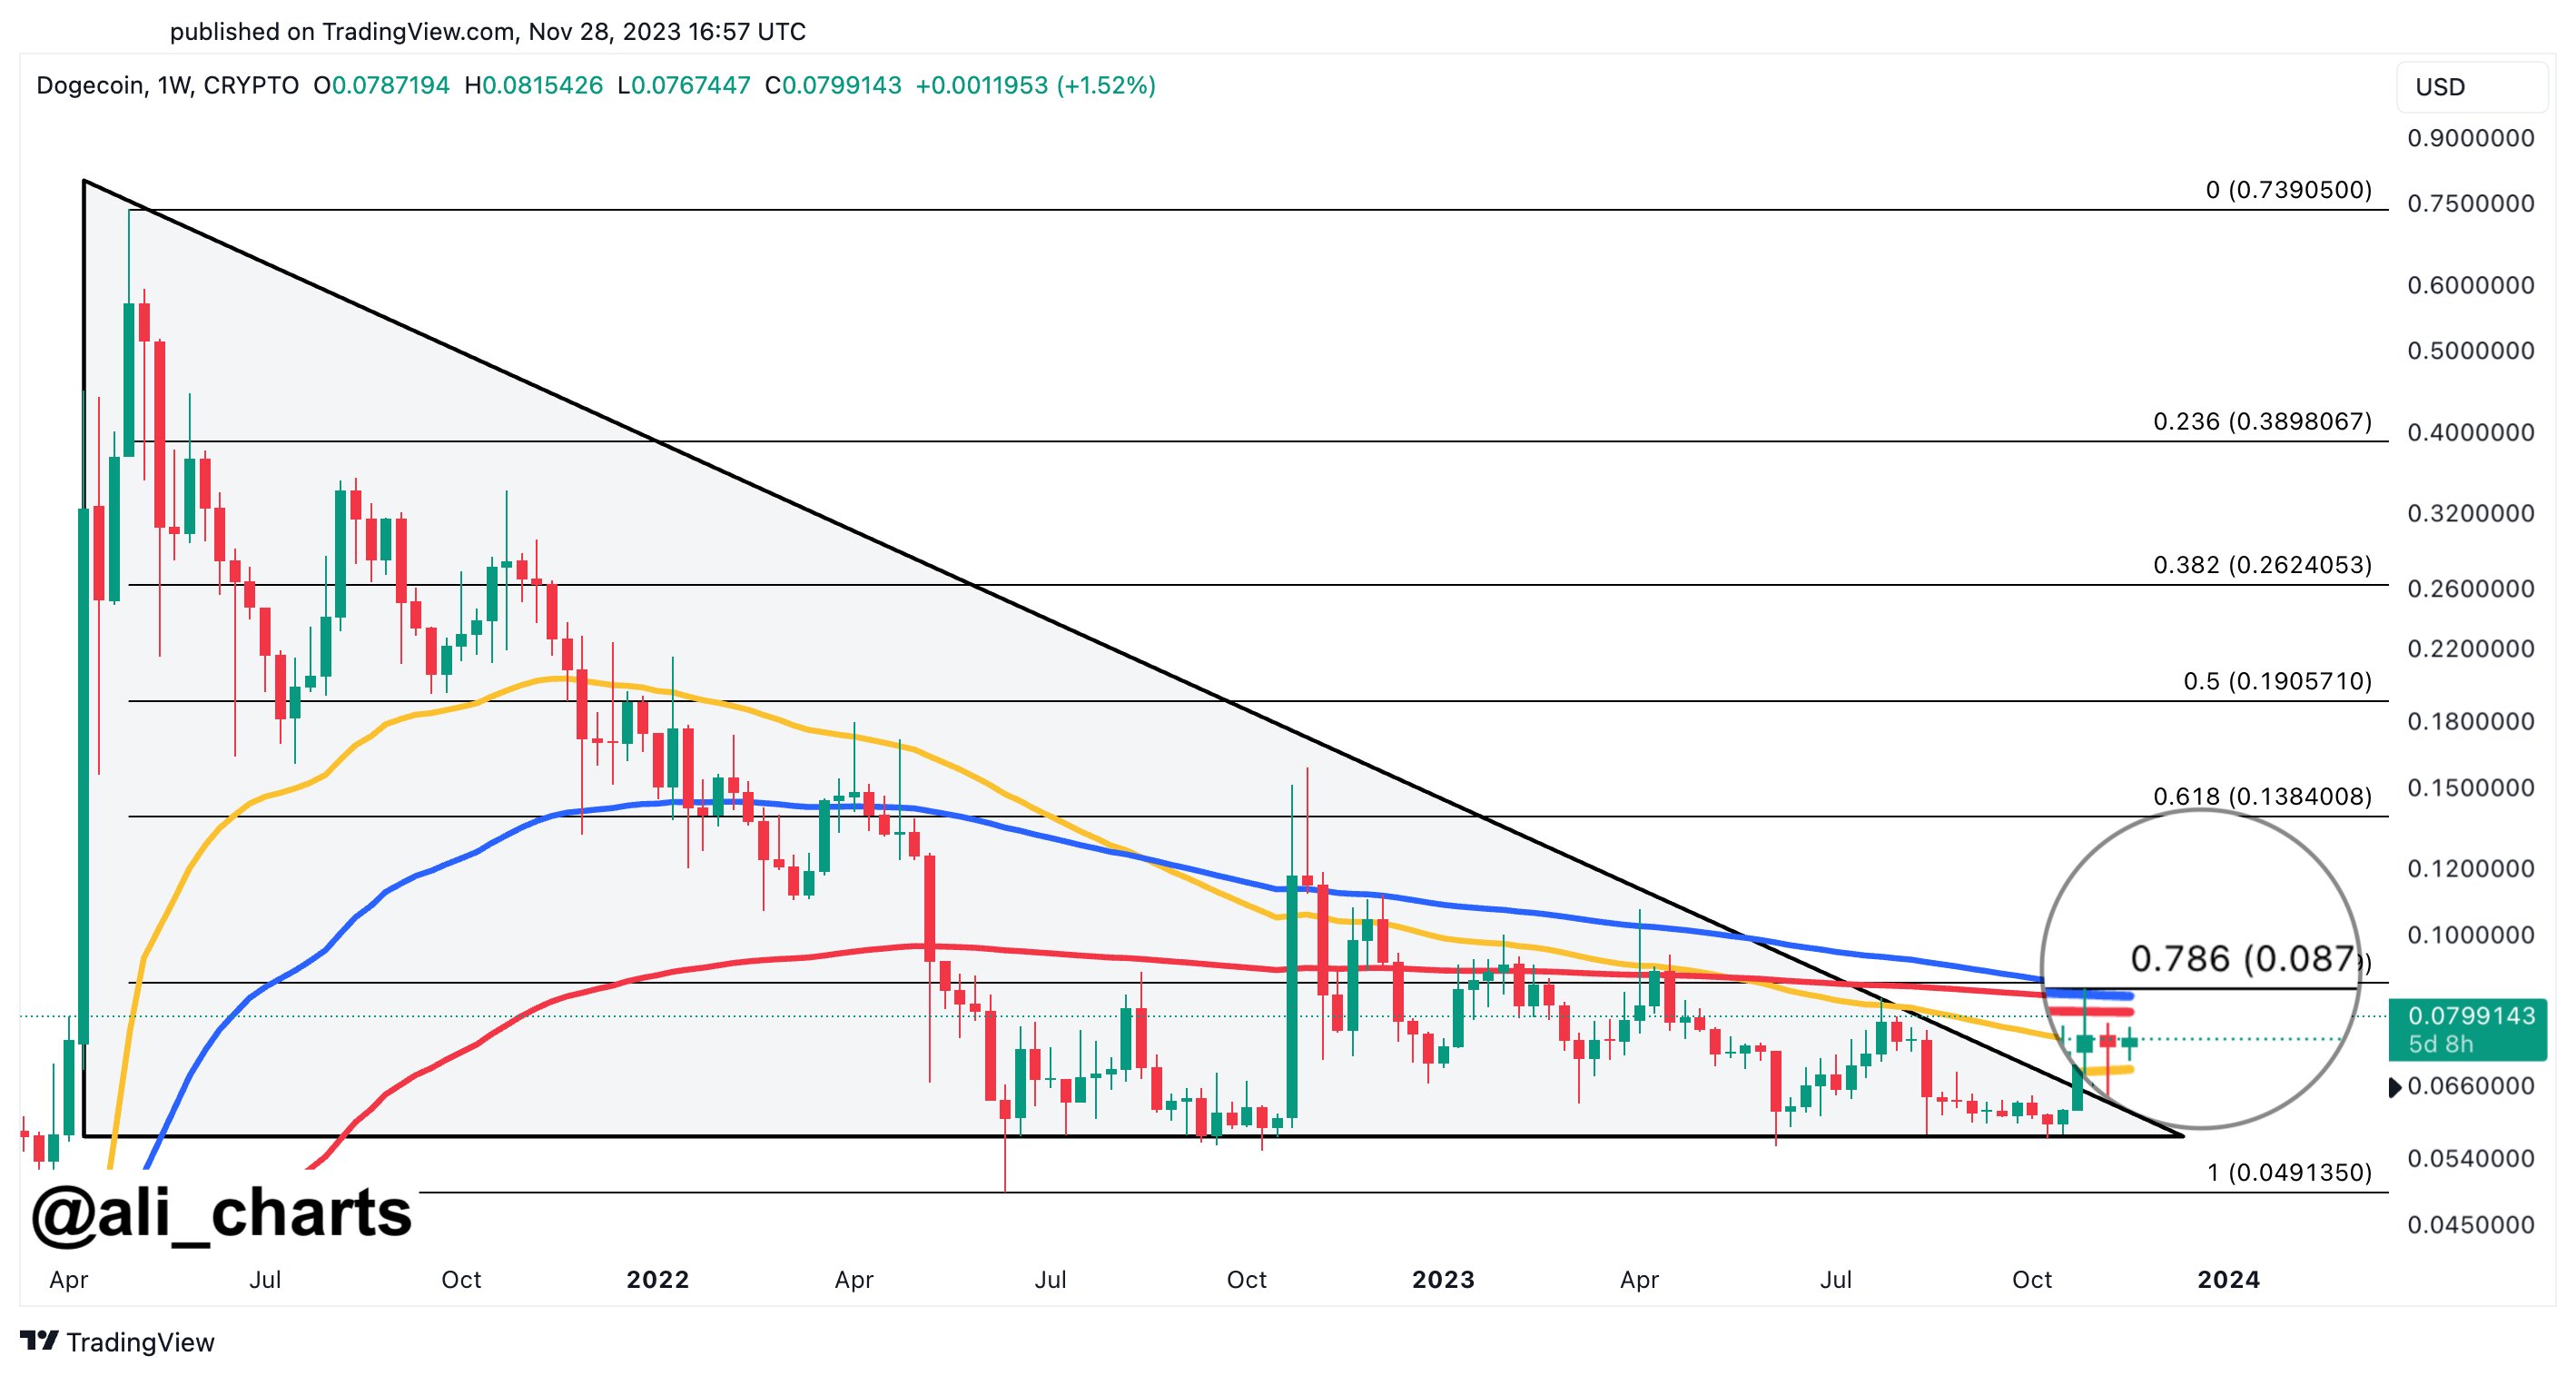
As is visible from the above graph, these two Dogecoin EMAs have approached each other recently and have converged into a narrow range around the $0.087 level.
In the past, these two EMAs of the cryptocurrency have posed resistance to the price and it appears that the weekly chart of Dogecoin has been struggling with them again, as it has been finding rejection here during the past three weeks.
These two lines aren’t the only ones converging near $0.087, however; it would appear that the 0.786 Fibonacci level is doing the same. The Fibonacci levels listed in the chart are some ratios derived from the famous Fibonacci series.
In this series, dividing any number (except for the first few) by its succeeding number always gives a ratio of about 0.618. The square root of this number is 0.786, which is the level the analyst has marked here.
Dogecoin thus has a major wall at $0.087, made up of the convergence of all these historically significant lines. “Breaking past this barrier could open the gates for DOGE to nearly double its price, aiming for a target of $0.14,” explains the analyst.
DOGE Price
Dogecoin has observed a surge back above the $0.080 mark during the past day, as the below chart shows. It now remains to be seen if the coin will go on to retest this $0.087 level that might be so crucial for the coin.


