Dogecoin (DOGE) is testing the lower boundary of a long-term triangle pattern, a move that could determine its next major price direction. A new technical analysis highlights a roadmap with key recovery levels and outlines a potential timeframe when selling and profit-taking may become favorable.
Dogecoin Triangle Pattern Signals Recovery Path
In a recent X post, crypto analyst Jonathan Carter presented a new analysis of Dogecoin’s price action, predicting that a potential recovery may be imminent. Carter explained that Dogecoin is currently testing a critical support area around $0.135 within a long-standing descending triangle chart structure. The setup is unfolding over the 3-day timeframe, with price action remaining above the pattern’s lower boundary. This zone has become a key battlefield between buyers and sellers.
Carter highlights that the ongoing support area offers a favorable risk-reward profile for market participants. Buyers stepping in at this level are attempting to prevent a breakdown that could invalidate the broader recovery outlook. This means holding above this support zone could keep Dogecoin’s bullish scenario intact.
The descending triangle visible on the analyst’s shared chart shows a series of lower highs pressing against the stable support zone at $0.135. This compression often precedes a decisive move once the price reacts strongly at the base. Dogecoin’s current structure also suggests the market is steadily approaching that inflection point.
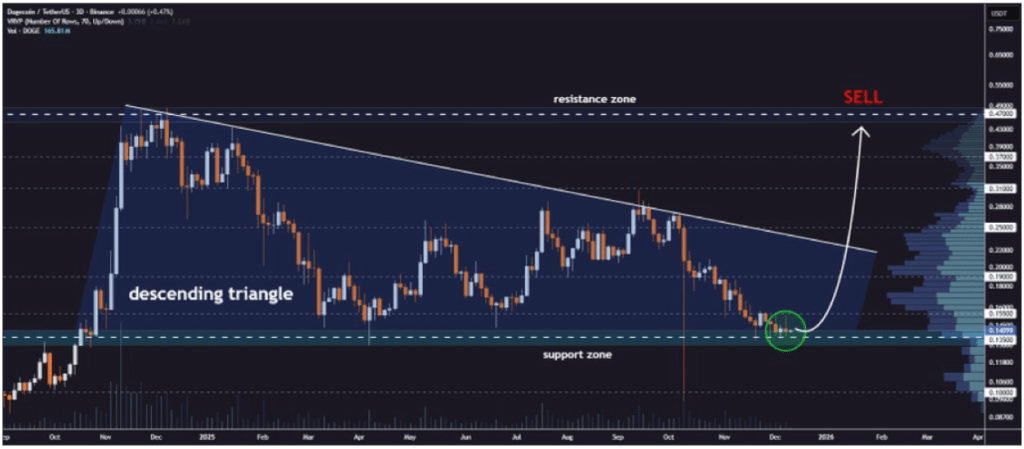
The volume data at the bottom of the chart has yet to show strong expansion near the support area. This indicates that Dogecoin’s trading activity has been relatively muted, suggesting that the market may be waiting for confirmation before committing to a significant upward move.
If Dogecoin successfully rebounds from the $0.135 support zone, Carter’s chart maps out several upside levels to watch. Initial recovery targets are seen around $0.155 and $0.190, where previous price reactions occurred. Clearing these levels would signal growing momentum and a possible end to DOGE’s downtrend.
Further upside extensions projected on the chart include $0.250 and $0.310, which align with previous consolidation areas. A stronger continuation could open the path toward $0.370 and ultimately the resistance zone near $0.470.
Resistance Zone Reveals When To Sell DOGE
Carter’s Dogecoin chart clearly shows the $0.47 resistance zone, where sellers are expected to become active again. A rally into the zone would likely face increased selling pressure based on historical price behaviour. As a result, the resistance area serves as a strategic level for profit-taking rather than for new entries in Dogecoin.
Overall, Carter’s analysis suggests that Dogecoin’s price is sitting at a pivotal technical level that could shape its next major move. The meme coin’s price is currently down, having crashed by over 22% year-to-date, according to CoinMarketCap. Despite this slip, Carter remains optimistic about DOGE’s recovery path. The recovery timeline highlighted in the analysis suggests that by 2026, the meme coin may have emerged from its downturn.
Featured image from Unsplash, chart from TradingView


