Crypto analyst Tolimanu has used the Elliott Wave Theory to provide insights into where Bitcoin currently is in this market cycle. Based on his analysis, the bull run is not yet over, with the flagship crypto set to reach new highs.
Elliot Wave Theory Shows Bitcoin’s Current Position In This Cycle
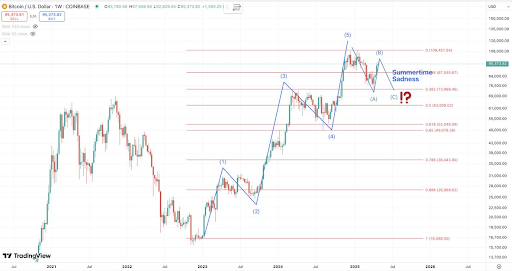
In an X post, Tolimanu noted that in Elliot Wave Theory, a 5-wave move up typically marks a primary trend, and an ‘ABC’ correction is a natural retracement of that trend. Based on this, he stated that unless this Bitcoin correction breaks major long-term support levels, such a decline would typically set up the next higher-degree bullish phase.
On the bearish side, his accompanying chart showed that Bitcoin could still correct to as low as $73,969 on wave C of the ABC correction. However, as the analyst suggested, a hold above this support level could send BTC to new highs.
Technical expert Tony Severino also recently warned that the Bitcoin price is in a precarious position. Despite the recent surge, he suggested that BTC is still in a bearish position. The expert remarked that if the daily momentum crosses bearish, it could prevent the weekly bullish crossover and pull the weekly LMACD below zero.
In another post, Severino noted that Bitcoin’s daily RSI failed to get above 70, which is a key trigger required for a bullish impulse. He remarked that failure at 70 the last time led to the most vicious leg down of the last bear market. He added that the entire bear market remained below 70.
The technical expert also noted that in 2023, the two local tops did make it above 70, but it wasn’t convincing enough, while in 2024, the entire corrective phase stayed below 70 on the RSI. Basically, Severino highlighted the importance of 70 on the RSI and how BTC is still in a bearish position.
BTC Looking To Fill CME Gaps Below And Above
Crypto analyst Titan of Crypto revealed that Bitcoin is looking to CME futures gaps below and above its current price. The upside gap is between $96,480 and $97,300, while the downside gap is between $91,990 and $93,400. In another post, the analyst suggested that BTC might fill the downside gap before moving to the upside targets.
This came as he noted that the next key support for Bitcoin is the daily Fair Value Gap, which is around $90,000. The analyst added that a bounce from that zone is likely. His accompanying chart showed that the target on this bounce is $102,096.
At the time of writing, the Bitcoin price is trading at around $94,300, down in the last 24 hours, according to data from CoinMarketCap.


