The price of Ethereum is currently on a downtrend and is approaching a significant support level. In the past 24 hours, there has been little movement on the chart, while on the weekly chart, ETH has experienced a depreciation of over 3%.
This downtrend in Ethereum is consistent with the volatile behavior of Bitcoin, which has been moving back and forth around the $26,000 price mark. Other altcoins have also been exhibiting similar patterns and the technical analysis of Ethereum indicates a bearish influence.
Both the demand and accumulation levels on the chart have remained low. So it is crucial for Ethereum to move away from the $1,700 support line to avoid further bearish pressure. If the price falls below this level, it may become challenging for Ethereum to recover.
Related Reading: MATIC Price Displays Recovery But Can Bulls Sustain The $0.50 Support?
Additionally, for Ethereum to initiate a recovery, Bitcoin needs to halt its sharp retracement on its own chart. The decline in the Ethereum market capitalization also suggests that sellers currently have the upper hand in the market.
Ethereum Price Analysis: One-Day Chart
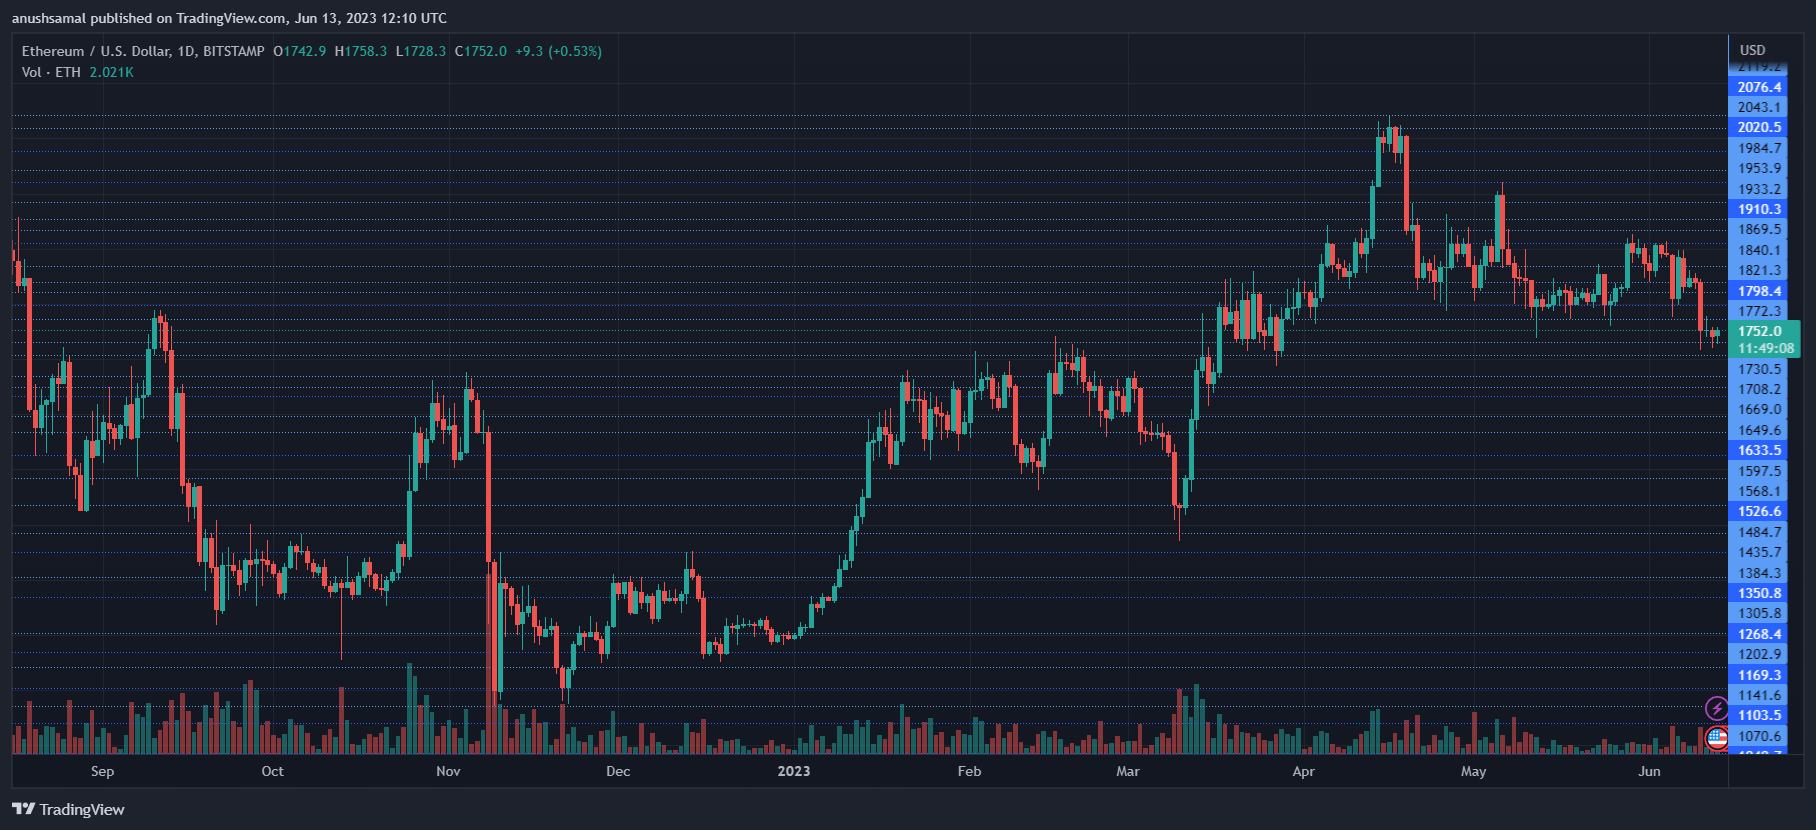
At the time of writing, ETH was trading at $1,750. Following a rejection at the $1,840 price level, ETH has been experiencing a downtrend with unsuccessful attempts at recovery. The coin faces overhead resistance at $1,770.
If Ethereum manages to surpass this resistance level, it may receive support from the bulls and potentially reach $1,800. Conversely, if sellers exert further pressure, Ethereum could drop below its nearest support level at $1,700.
A decline below this level would likely lead to a price of around $1,660 for ETH. The volume of ETH traded in the last session was indicated as red, suggesting low buying strength in the market.
Technical Analysis
Since the beginning of June, ETH has experienced a notable decrease in demand, which has coincided with increased market volatility.
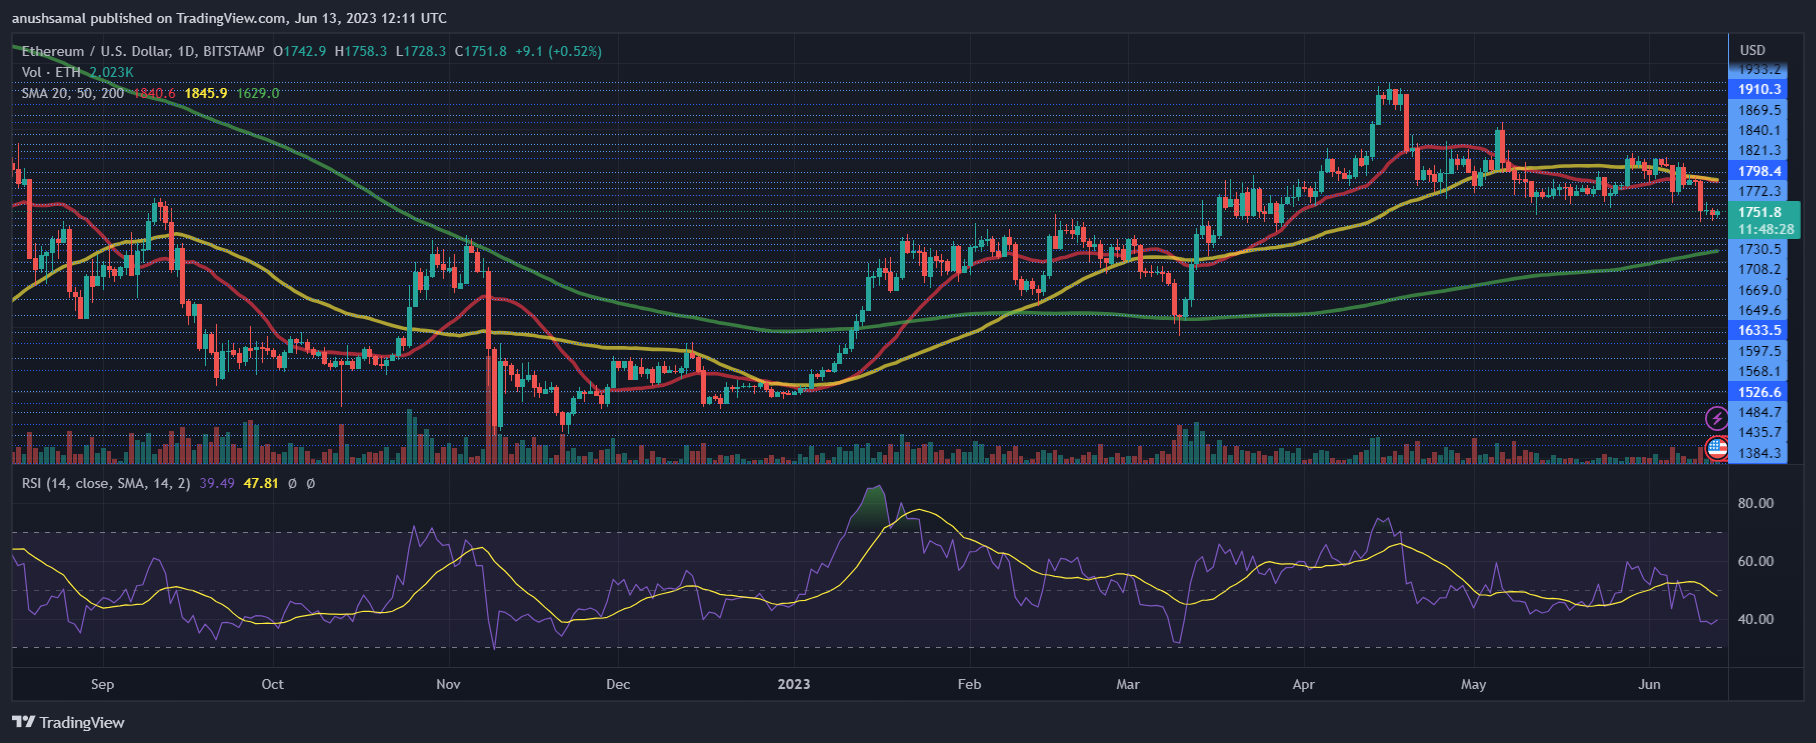
As a result, buyer confidence has declined. The Relative Strength Index (RSI) indicates that the market is oversold, as it is below both the half-line and the 40-mark.
Additionally, the price of ETH has fallen below the 20-Simple Moving Average, suggesting low demand and indicating that sellers are currently driving the price momentum in the market.
However, if ETH can surpass the $1,770 level, there is potential for demand to make a comeback. Breaking above this resistance level could attract buyers and potentially lead to an increase in demand for Ethereum.
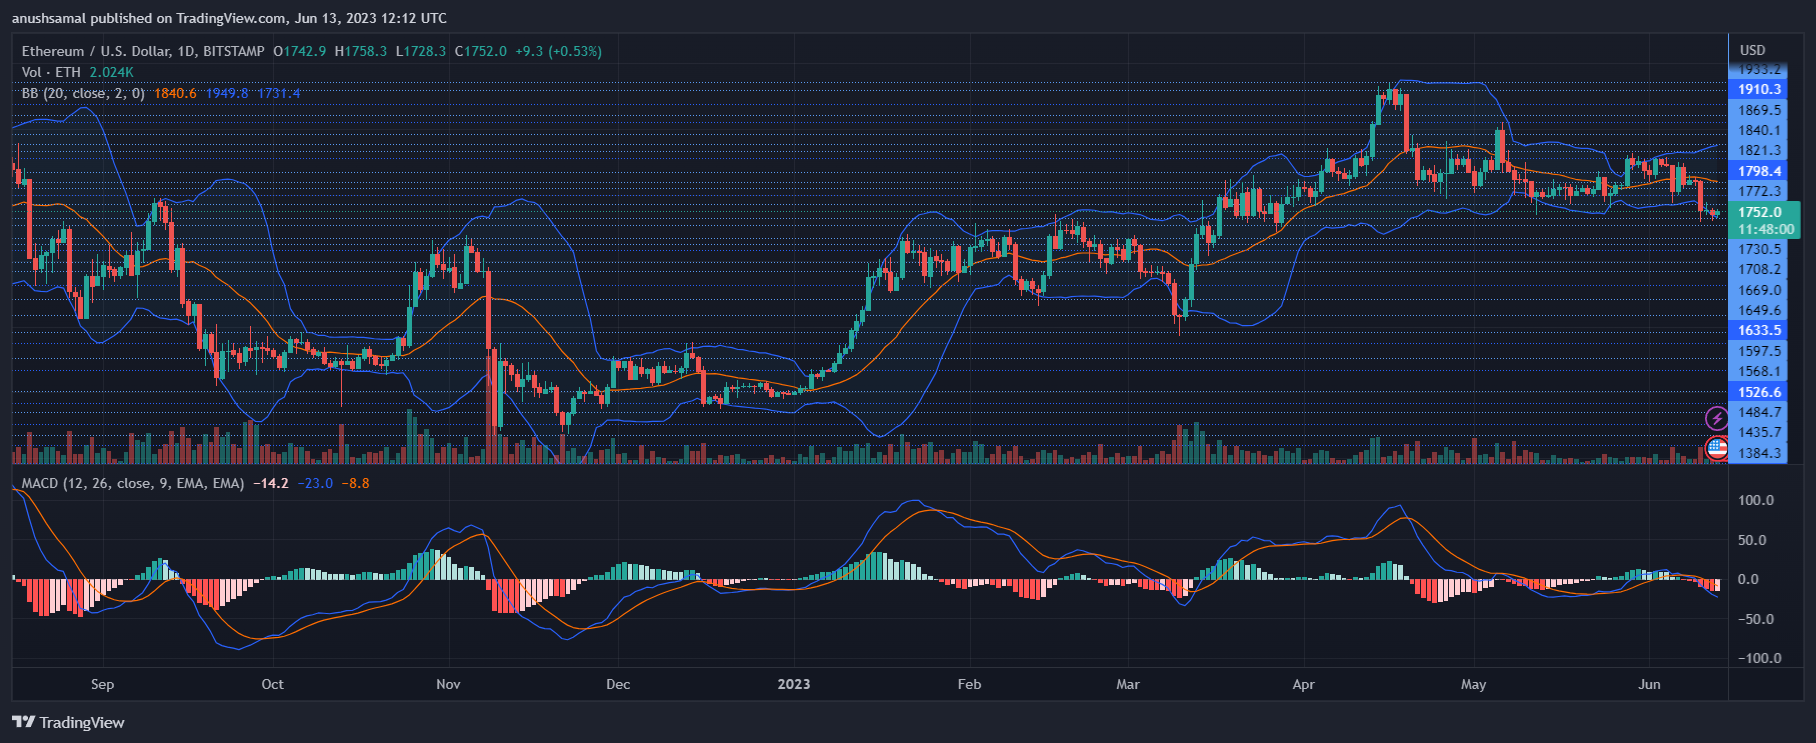
In addition to the previously mentioned indicators, other technical indicators on the chart of the altcoin suggest sell signals. The Moving Average Convergence Divergence (MACD), which measures price momentum and potential reversals, has formed red signal bars and these bars are associated with sell signals for the altcoin.
The Bollinger Bands, which represent price volatility and fluctuation, have started to diverge. This suggests that the price of the altcoin may experience increased fluctuations in the upcoming trading sessions. Given this, it is crucial that ETH holds the $1,700 support or risk rapid decline.


