In recent weeks, Ethereum has demonstrated a downtrend in shorter timeframes, where the bulls struggled to maintain the critical $1900 support zone. This allowed the bears to gain dominance. However, there appears to be a change in price sentiment during recent trading sessions.
On the daily chart, ETH experienced a 2% climb. A positive movement is observable on the weekly chart, although it remains relatively modest.
Despite the upward movement, there is a potential risk of waning bullish momentum if Ethereum fails to sustain its price above the immediate trading zone. From a technical standpoint, the altcoin is leaning toward bullishness, with increased buying strength apparent in recent trading sessions.
Both accumulation and demand have played a role in this positive shift. Furthermore, Ethereum’s market capitalization has grown, indicating heightened demand during the past trading sessions.
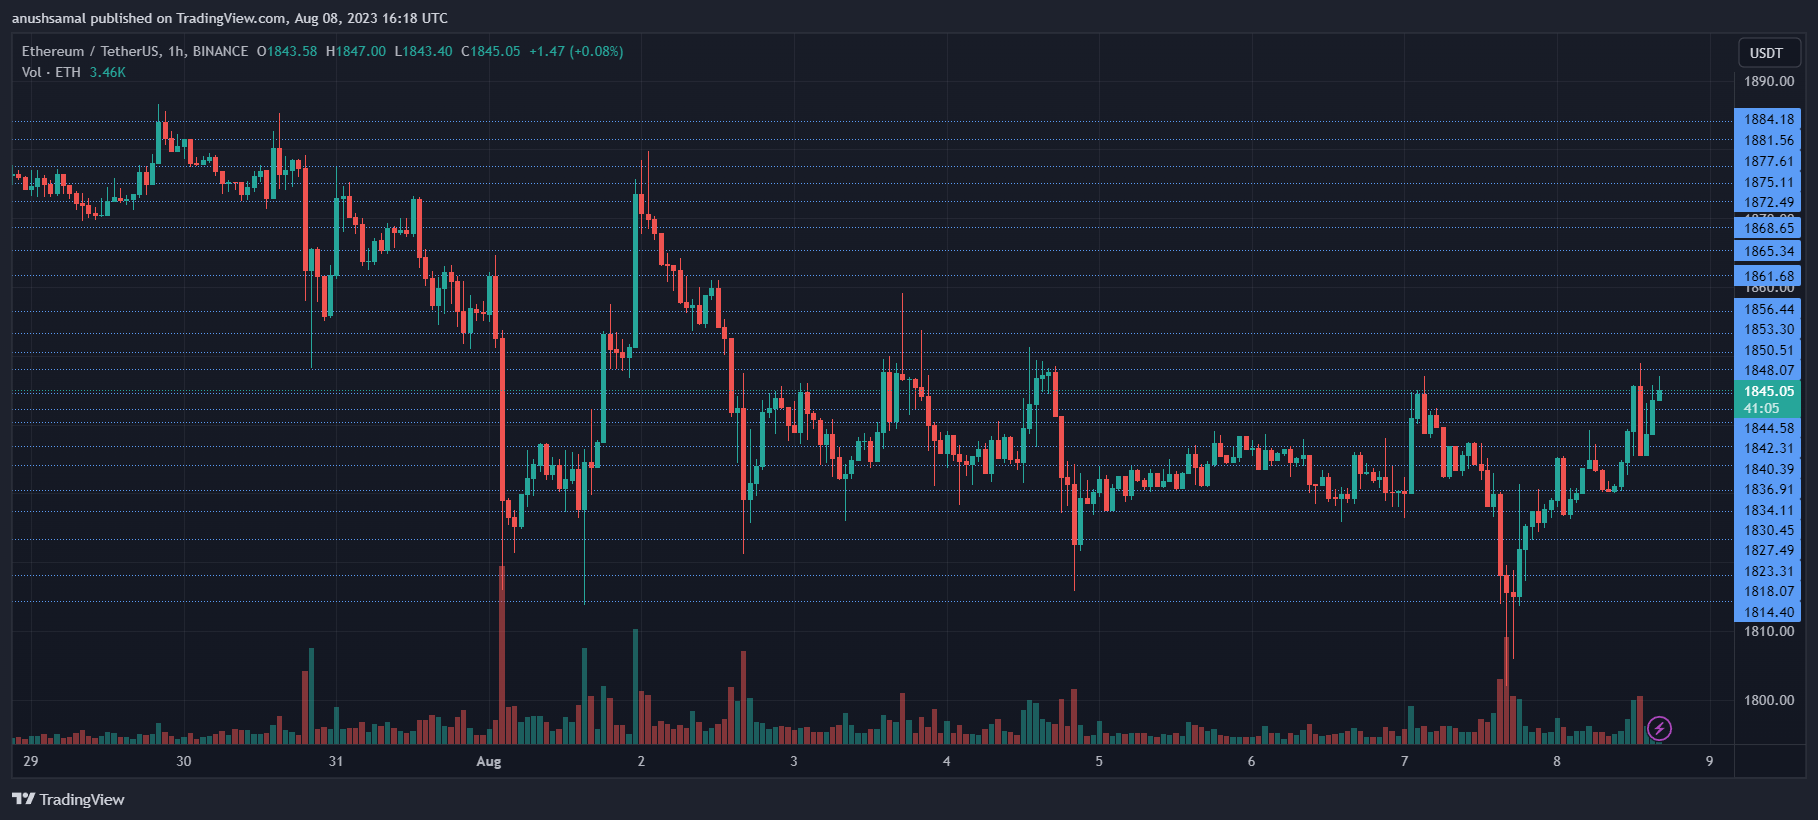
At the time of writing, ETH was priced at $1,840. It is currently nearing its immediate resistance level of $1,850, which has previously functioned as a liquidity pocket.
Approaching this level might trigger a price decrease. However, if the altcoin successfully surpasses $1,850 and establishes a trading position above the subsequent resistance at $1,870, it could signal a more prolonged period of bullish activity.
On the flip side, the support level is $1,780, followed by another at $1,760. Falling within this range might lead to further downward movement in the price.
The trading volume of ETH in the previous session was lower. However, the fact that it was in the green indicates that buyers were gradually entering the market.
Technical Analysis
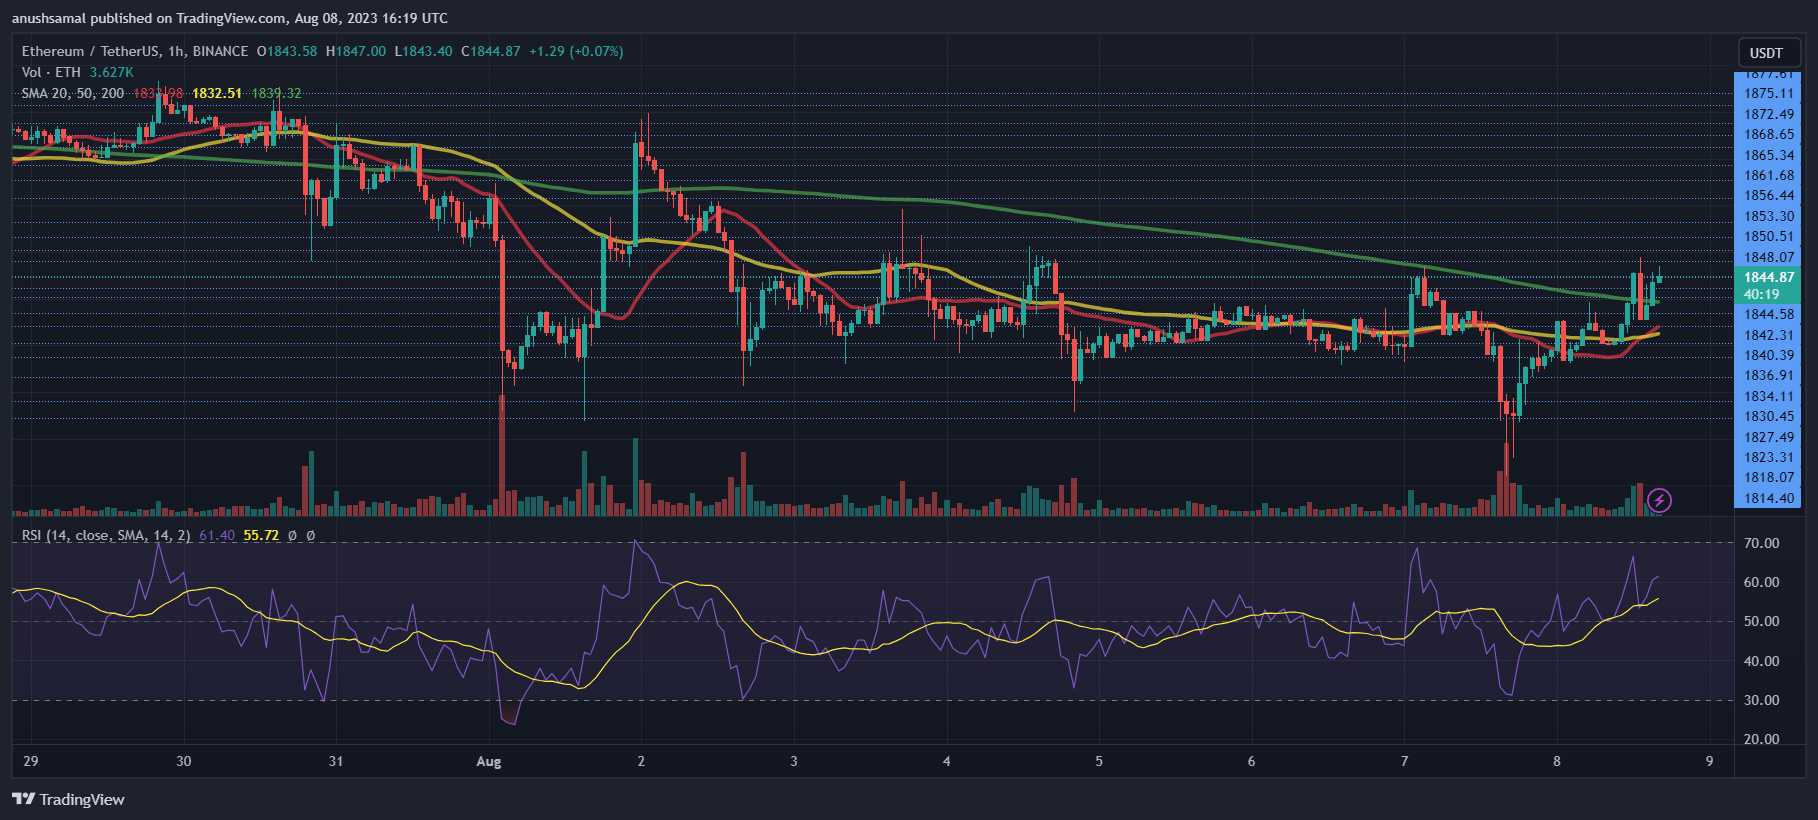
Regarding buyer activity, there has been increased demand for the altcoin following a notable dip within the past 48 hours. The Relative Strength Index (RSI) climbed above the 60 mark, suggesting a revival for the altcoin and signaling buyer engagement surpassed seller activity.
Furthermore, the price remained above the 20-Simple Moving Average (SMA) line, indicating that buyers were the driving force behind the market’s price momentum.
Another observation is that ETH remained above the 200-Simple Moving Average (SMA) line (green). This suggests a substantial price surge could be anticipated before the bullish momentum wanes.
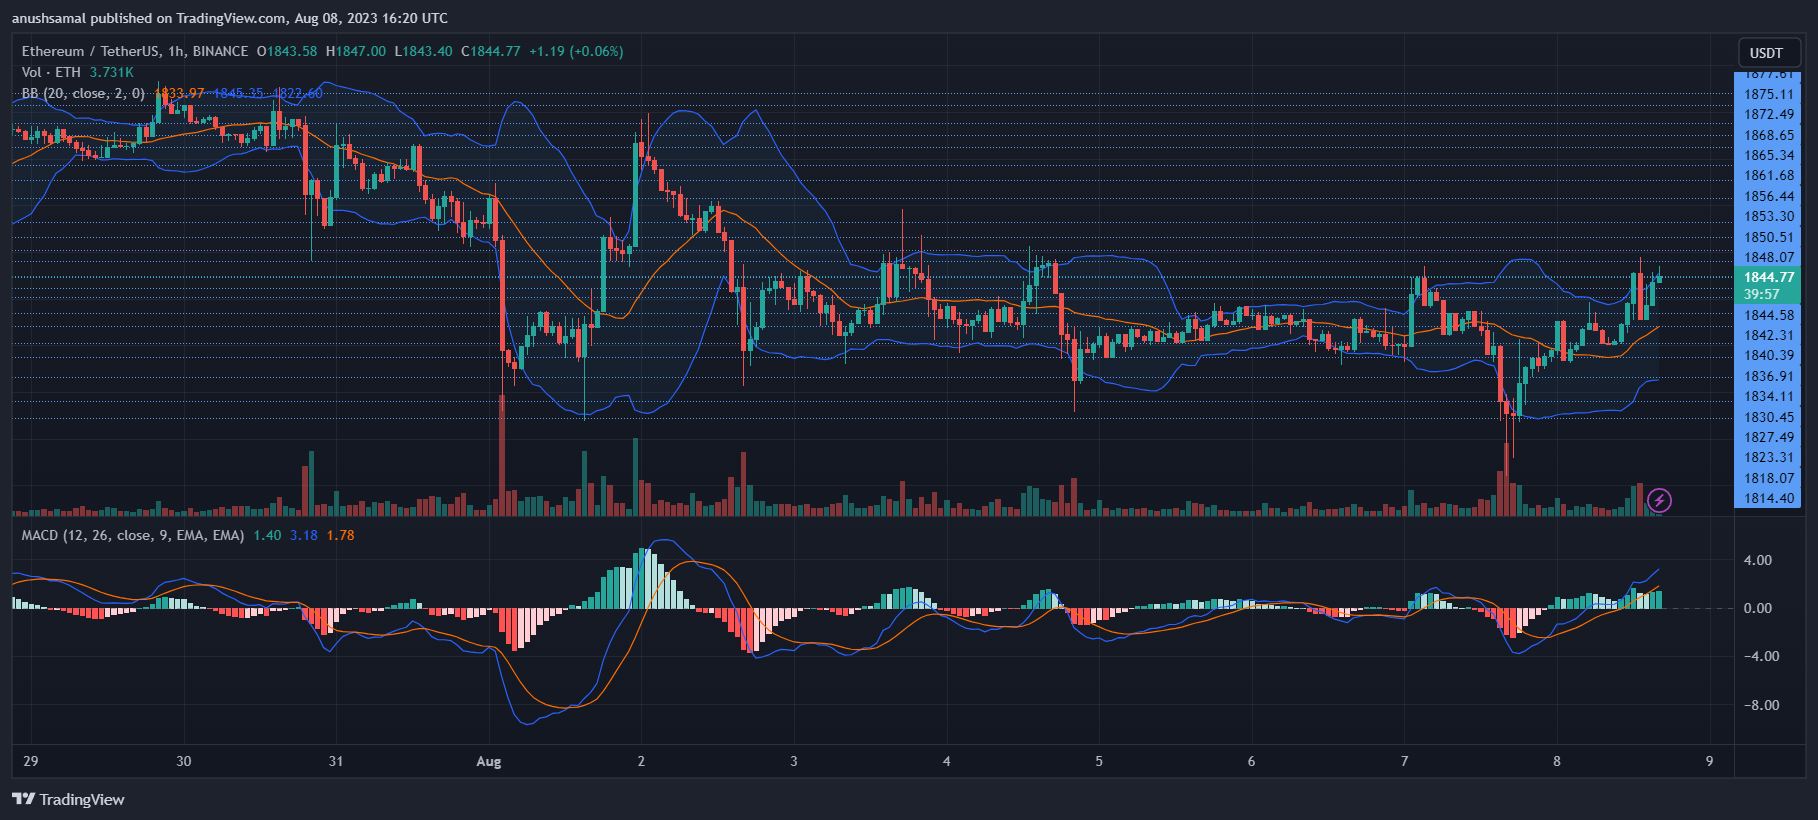
Correlating with the increase in demand, ETH exhibited buy signals on the daily chart. The Moving Average Convergence Divergence (MACD), which signifies price momentum and potential shifts, showed green histograms aligned with buy signals.
These buy signals also suggest a potential upward movement in the price over the subsequent immediate trading sessions.
Additionally, the Bollinger Bands appeared wide from each other, indicating the likelihood of price volatility, although not overly significant as the bands mainly remained parallel. These parallel bands coincide with the immediate resistance level.


