Ethereum price started a fresh decline from the $2,780 resistance zone. ETH is now trading below $2,650 and might continue to move down.
- Ethereum started a downside correction below the $2,700 level.
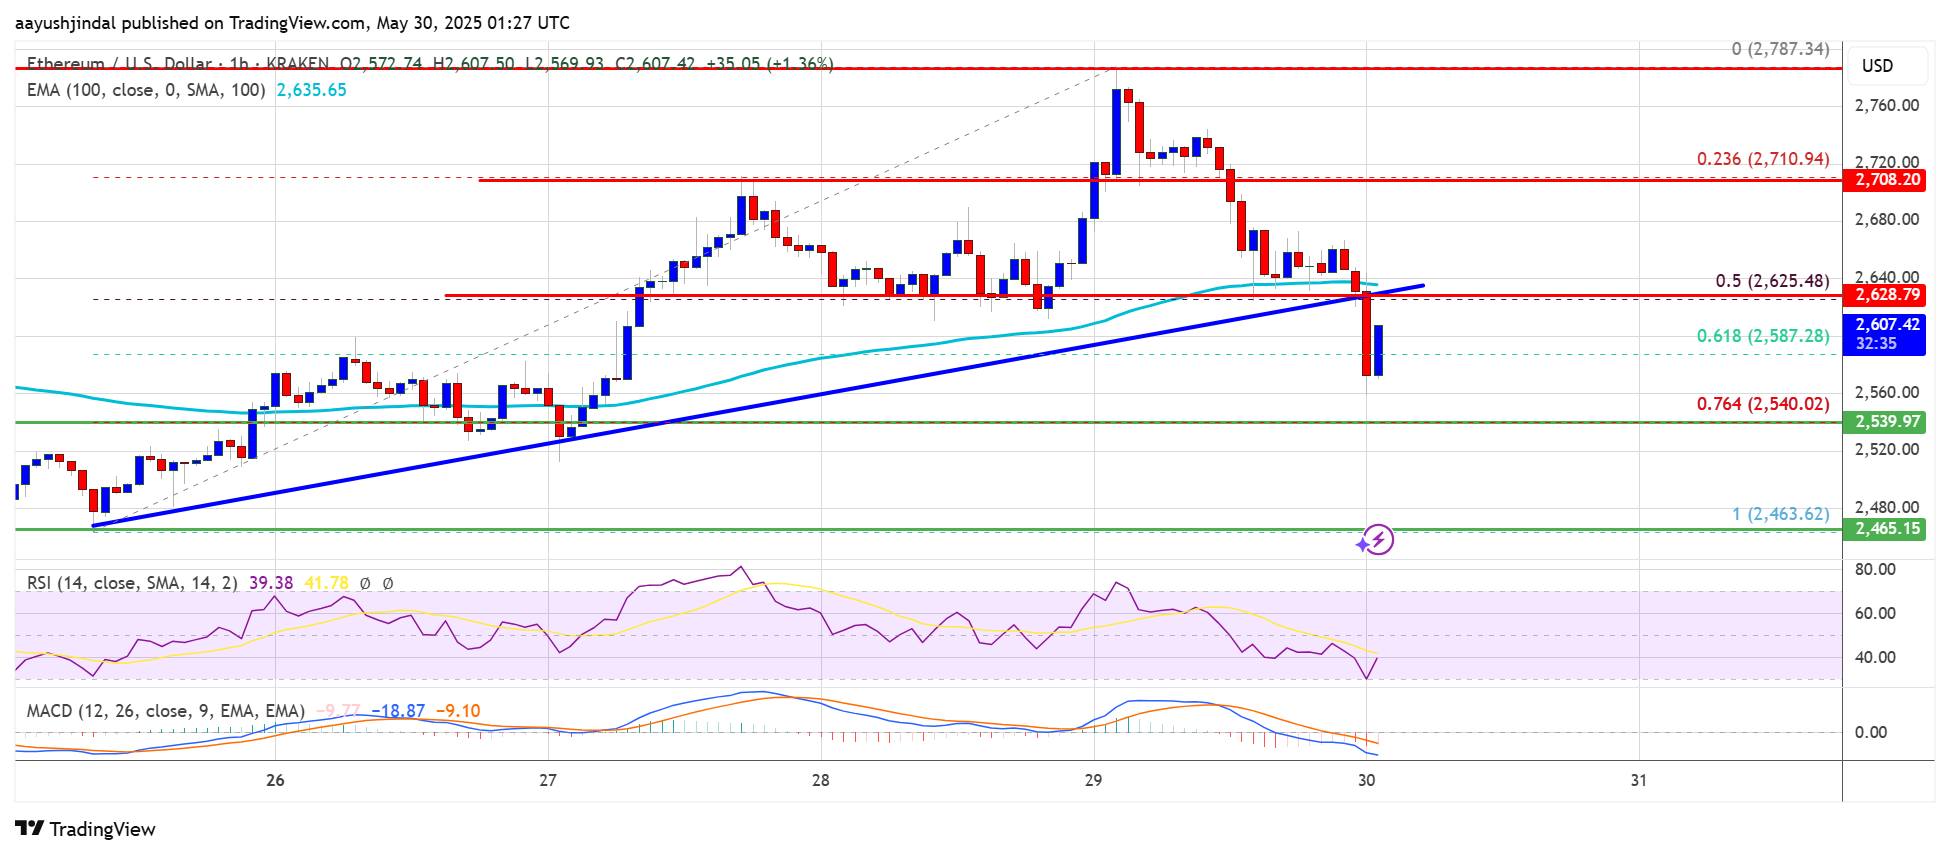
- The price is trading below $2,650 and the 100-hourly Simple Moving Average.
- There was a break below a key bullish trend line forming with support at $2,625 on the hourly chart of ETH/USD (data feed via Kraken).
- The pair could extend losses if it trades below the $2,550 support zone in the near term.
Ethereum Price Dips Again
Ethereum price started a fresh increase from the $2,550 support zone, beating Bitcoin. ETH price was able to recover above the $2,650 and $2,750 resistance levels before the bears appeared.
A high was formed at $2,787 and the price is now correcting gains. There was a move below the $2,700 support level. The price dipped below the 50% Fib retracement level of the upward move from the $2,463 swing low to the $2,787 high.
Ethereum price is now trading below $2,650 and the 100-hourly Simple Moving Average. Besides, there was a break below a key bullish trend line forming with support at $2,625 on the hourly chart of ETH/USD.
On the upside, the price could face resistance near the $2,625 level. The next key resistance is near the $2,650 level. The first major resistance is near the $2,720 level. A clear move above the $2,720 resistance might send the price toward the $2,780 resistance.
An upside break above the $2,780 resistance might call for more gains in the coming sessions. In the stated case, Ether could rise toward the $2,880 resistance zone or even $2,950 in the near term.
More Losses In ETH?
If Ethereum fails to clear the $2,650 resistance, it could start a fresh decline. Initial support on the downside is near the $2,600 level. The first major support sits near the $2,550 zone. It is close to the 76.4% Fib retracement level of the upward move from the $2,463 swing low to the $2,787 high.
A clear move below the $2,550 support might push the price toward the $2,500 support. Any more losses might send the price toward the $2,440 support level in the near term. The next key support sits at $2,400.
Technical Indicators
Hourly MACD – The MACD for ETH/USD is gaining momentum in the bearish zone.
Hourly RSI – The RSI for ETH/USD is now below the 50 zone.
Major Support Level – $2,550
Major Resistance Level – $2,650


