Ethereum price dived over 10% before the bulls appeared near $2,550. ETH is back above $3,000 and now faces many hurdles near $3,200.
- Ethereum is attempting a recovery wave from the $2,550 support zone.
- The price is trading below $3,250 and the 100-hourly Simple Moving Average.
- There is a rising channel forming with resistance at $3,200 on the hourly chart of ETH/USD (data feed via Kraken).
- The pair could gain bullish momentum if it stays above the $3,000 support zone.
Ethereum Price Eyes Recovery Wave
Ethereum price started a major decline from the $3,550 resistance. ETH declined over 10% and traded below the $3,000 support. It even spiked below $2,750 and tested $2,550.
A low was formed near $2,537 and the price is now attempting a recovery wave, like Bitcoin. The price climbed above the $2,800 and $3,000 resistance levels. It even surpassed the 50% Fib retracement level of the downward move from the $3,615 swing high to the $2,537 low.
Ethereum is now trading below $3,250 and the 100-hourly Simple Moving Average. Immediate resistance is near the $3,200 level or the 61.8% Fib retracement level of the downward move from the $3,615 swing high to the $2,537 low. There is also a rising channel forming with resistance at $3,200 on the hourly chart of ETH/USD.
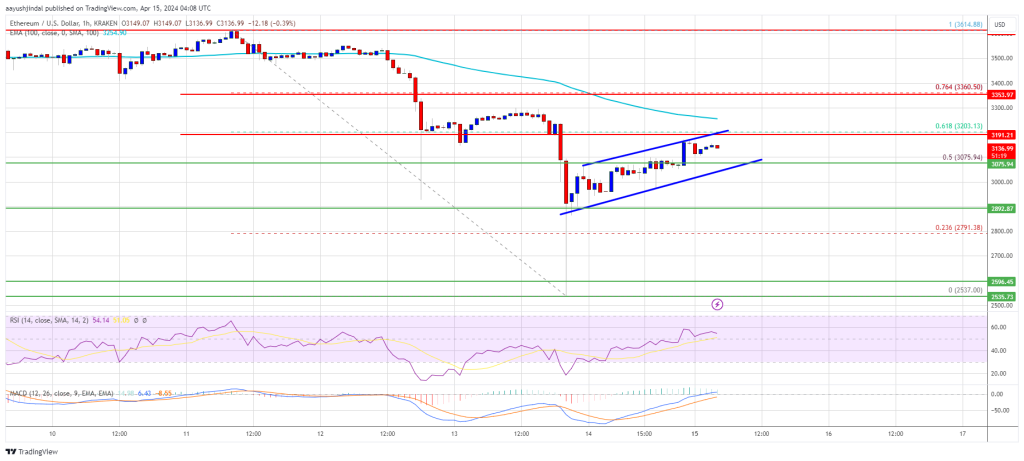
Source: ETHUSD on TradingView.com
The first major resistance is near the $3,250 level. The next key resistance sits at $3,300, above which the price might test the $3,360 level. The key hurdle could be $3,500, above which Ether could gain bullish momentum. In the stated case, the price could rise toward the $3,620 zone. If there is a move above the $3,620 resistance, Ethereum could even rise toward the $3,750 resistance.
Another Decline In ETH?
If Ethereum fails to clear the $3,250 resistance, it could start another decline. Initial support on the downside is near the $3,080 level.
The first major support is near the $3,000 zone. The next key support could be the $2,880 zone. A clear move below the $2,880 support might send the price toward $2,750. Any more losses might send the price toward the $2,550 level.
Technical Indicators
Hourly MACD – The MACD for ETH/USD is losing momentum in the bearish zone.
Hourly RSI – The RSI for ETH/USD is now above the 50 level.
Major Support Level – $3,000
Major Resistance Level – $3,250


